

This is one of the shortest and the simplest lessons of the course.
For those who have not read the previous articles, it should immediately clear up two things: Firstly, I strongly recommend testing. I guarantee, even if you are a trader with a lot of experience, something from my ideas will probably resonate with you. Secondly, in the course, I share only my own experience. While trading, I do not use trading advisors (except for the risk manager that I will talk about separately) and I do not use automated trading.
Thus, in this article I will discuss only manual trading and testing strategies performed by the trader on his or her own. I suggest only 2 elementary ways that do not require additional services, downloads, or purchases of plug-ins and advisers.
Table of Contents
THE FIRST METHOD: SCROLLING THE CHART

It sounds funny, but it is the fastest and the most reliable method of testing. Running ahead of the story, we will use this method when course readers will formulate their own trading rules. Then they will have to come up with and test at least 10 different strategies. The fastest way to test them is by doing it on the chart itself.
The algorithm of actions is as follows:
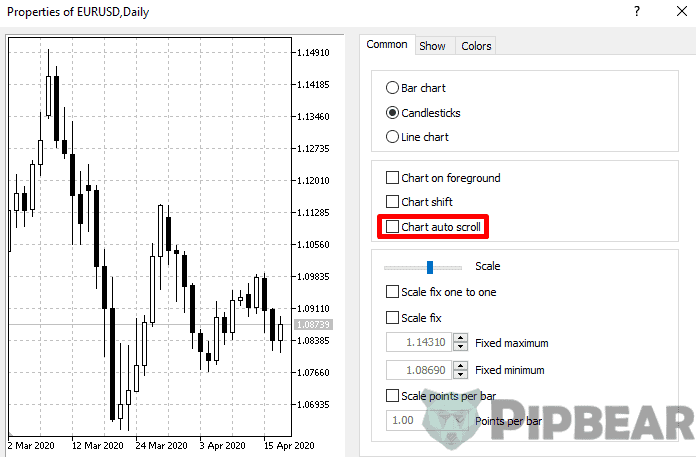
- Open the chart of the target instrument in the trading platform. I have chosen EUR/USD as an example. We should customize the layout of the chart, select the timeframe and add technical analysis tools (indicators and/or oscillators, if necessary).

- We should turn off the auto-scrolling of the chart.
- For convenience, we should minimize the right edge of the platform.

- Sit comfortably.

- After that we should press the F12 on the keyboard, moving the chart for 1 candlestick to the right. In this way, we are gradually moving the chart, imposing our trading strategy on its history.
- For clarity, I recommend using the graphic elements, such as arrows, to fix marks where the trading position is opened and closed according to the strategy being tested.
ADVANTAGES OF THE METHOD:
- It is very fast. You can instantly test fresh ideas right as you’re trading;
- it is demonstrative. The graphic tools will help you to display the transactions and leave the necessary comments right on the chart; and
- you can use an unlimited number of technical analysis tools. Move any indicators, oscillators, shapes, grids, and so on to the chart.
DISADVANTAGES OF THE METHOD:
- It is not dynamic; when we scroll, we see candles already drawn, not seeing how they were formed in real-time mode. Seeing candles already drawn, you do not doubt that you would open this or that trading position at the right moment, but, in the process of forming a candlestick, it is easy to hesitate and not be able to open the position at the right moment.
- It is impossible to trace the redrawing of the indicators (see below).
STRATEGY TESTER TOOL IN MT4 (MT5) PLATFORM
I have already mentioned the strategy tester in a detailed review of the MetaTrader 4 terminal. This tool is mainly used for testing advisers, but for those who use candlestick analysis, the Price Action method, or Price Action trade with one indicator.
To open the strategy tester, select the corresponding button in the view menu, look for the icon in the toolbar, or open by pressing the Ctrl + R.

The tester has the ability to test either the Expert Advisor or the indicator. There is no third option, so, if you do not need any advisers or indicators, choose the Moving Average indicator. In the chart there will appear the moving average line which is easy to pay attention to.
Let’s look through the settings of the strategy tester in brief: After selecting the indicator, select the symbol. You must understand what kind of instrument you are going to trade and, accordingly, choose it.

Then we are offered to choose from three graphic rendering models: Every Tick, Control Points and Open Price Only. In 99% of cases, we will only use the Every Tick model which shows each movement of the price when rendering the chart.
Choose a timeframe. It completely depends on your trading approach. If it involves analyzing the market with 5-minute candlesticks, choose 5 minutes. If you are analyzing a 4-hour chart, select the appropriate value from the drop-down list.
Spread. This field is important when testing a trading advisor, as the system will calculate transactions and on the Results tab it will give the result of the backtest. In order for the financial result of the work of the advisor to be as accurate as possible, you need to specify the real spread that you have in accordance with the terms of the broker. When testing a manual strategy, you can choose any value (not changing the original one).
Be sure to tick off the “Use Date” checkbox and choose the period for which we want to render the chart. It is in this time range that we will test ideas. Let’s say I want to see the chart for July 2017. In this case, in the first field I will indicate the following value: 2017.01.07, and in the second one: 2017.31.07.
If you are going to test the indicator, its settings can be adjusted by pressing the Indicator Properties button.
After pressing the Start button and after a small (usually within 3 minutes) pause during which the data is loaded, a chart will appear on which the candlesticks for the indicated period will be drawn.

The chart can be given a familiar look by analogy with how you do it with all other charts, by clicking on the workspace with the right mouse button and selecting the Properties option. By adjusting the color scheme, you can add any technical tools to the chart and proceed with the analysis.
THE ADVANTAGES OF USING THE TESTER:
- Display of price in dynamics, maximum clarity.
- One can clearly observe the redrawing of indicators.
We will touch the topic of redrawing indicators in detail; this is an extremely important thing to understand. In short, the problem is that, at the stage of opening a transaction, a trader can see a certain pattern on the indicators, but after some time (after closing the candles, etc.), the indicator may show other data. If the basis of the calculation is the closing price (close), then until the expiry of the time period, the indications will remain intermediate.
The use of a strategy tester is compulsory for adherents of indicator strategies. In the testing mode, the trader can analyze not only the profitability of the strategy but also the behavior of the indicator in real-time.
THE DISADVANTAGES OF USING THE TESTER:
- It is not suitable for strategies with several analytical tools (only one indicator can be applied to the chart).
- The chart cannot be scrolled, loading the tester takes time. Although this method of testing manual strategies is more vivid, it is slower.
- The need to re-configure the workspace (to change the color scheme, overlay the indicators, and so on).
MY RESULTS AND CONCLUSION
We have analyzed the two main methods of testing manual trading strategies in the MetaTrader 4 platform. On the Internet, you can find many additional tools with an expanded functionality, which, among other things, are designed for testing automated trading systems and advisers.
If you have been following this course since the first lesson, you probably noticed my skepticism and distrust of the trading robots between the lines. I am truly a 100% adherent of manual trading for the following reasons:
- Some things cannot be automated.
- Nobody will ever sell you a truly lucrative robot or advisor.
- Any robot or advisor has a lifetime. It can bring profits 2-3 months, after which the market will change a bit, and the old algorithm will turn out to be non-functional. At this point, the robot loses all earnings previously earned.
Do you already know how you will test your trading ideas? Write it in the comments on the lesson. It will be interesting to revisit these later.
Yours sincerely, Pipbear


I have one problem with back-testing, where we have a lagging indicator, back testing can be misleading. For example, I tried to backtest with SMA, the signal was so fulfilling. But when I applied the same in real life, I noted it was not the same as back testing. I guess we should be careful when back testing with some of these indicators.
Back testing can be inaccurate sometimes, it does not consider fundamentals happening in the market. If for example am testing a method, some occurrences may have been as a result of fundamental factors, is there a way to easily accommodate fundamental factors while back testing?
This guide acts as an eye opener, I already have an existing trading method, I thought of putting it into use, but I guess I will have to do a back test first
Thnks a lot, this is a great read……
Many new and experienced traders fail because of this basic principle, test before you trust. I Second pipbear in this. However good you think your method is, try to do a back test for a few months. But again a back test may not reflect the same results as actual trading.
I read a comment about lagging indicators. I had a trading method that was 100% when back-tested but when put into trading, it literary wiped my account. Guys take caution!
Thumbs up admin, you are doing a great job
I don’t see the value of doing back test. If it worked in the past, nothing guarantees you it will work in future. Market conditions are changing every day, Last year we didn’t have Trump in power, today the market reacts differently under trump. The best thing is to come up with a system, start trading with it in a demo market, and fine tune it to perfect it.
Why don’t you prefer automatic trading and back-testing? I believe it is faster and more efficient to let a robot work for you.