

The Bears Power Indicator is a classic oscillator determining the strength of market sellers at a certain timeframe. Alexander Elder, a USSR-born American trader developed this simple and convenient tool as a part of his complex Elder Ray Indicator.
Before reading the article and writing your questions in the comments section, I recommend watching this video. It’s not long but covers the biggest part of questions on the topic.
You can find a detailed description of the indicator in his book “The Basis of Marketplace Trading”. The traders rarely use the indicator as a separate analysis tool.
Table of Contents
Description of the Bears Power Indicator
I think it would be wise to start with some general information. Any financial market consists of the buyers (“the bulls”) seeking to increase prices and the sellers (“the bears”) who want to reduce the value of the assets. If you analyze the price chart over a certain timeframe, you may see who and when had the strength. When the trading session is over, it is finally possible to determine who has been stronger during the day (or any other period). If the price has turned out to be higher than it was last time, then the buyers have won. If the price has fallen, the sellers had the advantage. The extremums within the period reflect the way the players were struggling.

The Bears Power Indicator has the form of a histogram showing the difference between the lowest day price (week, month, etc.) and a 13-period exponential moving average. The local minima is considered the point at which the bears had the greatest advantage and respectively, the maxima is the time of their weakness.
People treat the Moving Average as the standard of fair price at any timeframe.
The exponential type of the moving average is chosen since the last data received is more important while determining the outcome of the struggle between the sellers and the buyers. The Moving Average line is a zero level, relative to which the oscillator chart is placed.
You can predict the further direction of the price movement and so get enough time to open or close the positions at the most appropriate moment if you hinge upon the changes in the indications of the Bears Power. If the bearish trend is dominating over the market, the histogram is below zero. If the chart crosses this point, then you may consider that strength of the sellers has fallen sharply.
You can find the Bears Power Indicator as a separate analysis tool in the “Oscillators” section at the standard set of the most popular trading terminals. You have only one setting to adjust, which is the color of the histogram. This oscillator becomes most efficient in conjunction with its “mirror twin” the Bulls Power Indicator. This combination is used in the Elder Ray Indicator.
How does the Bears Power Indicator Perform?
This indicator generates quite clear trading signals. A strong uptrend is a necessary condition for buying. You will get the best signal when the histogram first crosses the zero line bottom-up and then gets back for a short period. It means that the market has been retracted and the bullish trend is likely to continue.
Many traders assume that a consistent update of the highs in the positive zone is a sign of a complete decay of the downtrend. In this case, the histogram that tends to the negative zone may be considered a retracement, after which the bullish trend will continue to gain its strength. Another dubious call for selling is a steady growth of the Bears Power Indicator when it is below zero line.
Divergence between the oscillator and the price chart is the strongest signal of the oscillator. This is a discrepancy where the price updates its minima and the histogram shows a certain rise relative to the previous low.

Such a discrepancy may indicate that the price trend keeps moving by inertia and the price is very likely to reverse soon. If the progressive growth of the indicator is confirmed at the next low, you should make a purchase. You can accept this message only when Bears Power is in the negative zone. Divergence occurs not so often and you should pay attention to each signal of this kind.
You should remember that the larger is the timeframe, the fewer messages will be generated. If you reduce the timeframe, you will be receiving more signals but many of them will prove to be false. The choice of timeframe depends solely on the behavioral preferences of the trader.
Conclusion
The Bears Power Indicator has a drawback inherent with all the modern oscillators. We are talking about a delay. You can mitigate this disadvantage by using additional trend indicators. For example, you may use a typical moving average and add the Parabolic SAR indicator for better efficiency. Also, the oscillator does not take into account the market volume ratio in its calculations and therefore it is impossible to guarantee the complete objectivity of evaluation of the Bears Power. I don’t think there is any need to prove that the Bears Power Indicator must be used only together with the Bulls Power Indicator. It would be difficult to expect some favorable results without using other technical tools.
Naturally, the tool has its advantages. For example, the simplicity of the chart that allows us to read the signals quite clearly. It works perfectly well with almost every popular technical analysis tool. The Bears Power Indicator has proved its efficiency in the stock market, and also in the currency and commodity markets. There are few indicators able to bring such results to the table!
The Bulls Power Indicator
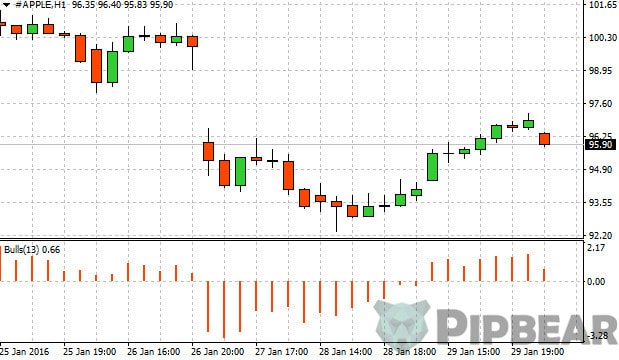
The Bulls Power Indicator is a simple and efficient analysis tool allowing to determine the mood of the buyers (“the bulls”) over a selected timeframe. It is used most often in conjunction with the Bears Power Oscillator performing on the same principle but in respect of the sellers.
You may have also read about the Elder Ray Indicator, which represents a complex indicator consisting of these two elements. Like the medical X-ray that can detect subtle fractures, the Elder Ray Indicator can detect serious “traumas” of the trends. All the mentioned tools were invented by the famous Alexander Elder.
Description of the Bulls Power Indicator
If the market closed on a higher level than it had done on the previous timeframe (a day, a week or any other period), then “the bulls” gained the upper hand. If the price fell, we could say that the sellers had won out. You may judge how the market was developing during the period by the interior extremums of the chart.
The Bulls Power Indicator represents a histogram displaying the mood swings of the buyers. It is calculated as the difference between the maximum price and the exponential MA, which is the average value of all the prices over the specified period.
Why use the EMA instead of a Simple Moving Average? The thing is that this type of the Moving Average can see the trends much faster since it works with the later data. For example, a simple 10-day Moving Average estimates the last ratio of 10% the same as it has estimated all the previous ones. A similar EMA counts the last day as 18%. Besides, it doesn’t change so sharply in contrast to a Simple Moving Average that resets all the previous data at once.
If the difference between the maximum price and the EMA is positive, we will see the oscillator’s chart above the zero level. If the bulls’ strength was less than the average price over a certain timeframe, the histogram will be in the negative area. It means that the buyers’ attitudes have been seriously undermined.
How to use the Bulls Power Indicator?
If the histogram is steadily decreasing but has not left the positive zone yet, then it is a good moment to open the selling positions. If the chart has already gone in the red, it makes no sense to sell hoping for the further fall.
You will get the strongest signals to sell short when a divergence appears between the price and the oscillator charts.

If the price chart updated its high and the Bulls Power Indicator displayed a slight decrease at the same moment, the current trend is very likely to weaken significantly. This may be a sign that the price keeps moving in the same direction by inertia and soon it will be reversed or retracted. If the next peak of the indicator is even lower, you should quickly start to sell short. At the same time, the histogram should remain in its usual position, that is, the positive values area. You should treat each divergence signal with due attention as they occur not so often and in most cases are proved to be true.
If you are planning to buy, wait until the histogram grows in the negative zone.
Many experts believe that if the chart keeps sliding down in the negative zone, it is a true sign of the downtrend ends.


what broker you use and minimum deposit thnx and very nice article
Wonderful stuff! I was aware of all this indicator being around the candlestick movements, but I did not understand it
Great piece. In need of some steady financial advice
Hi and thx for this piece. I especially the indicator, is this a downloadable indicator for mt4 or just for the platform you’re using?
Excellent material and well presented. Thanks for sharing this. In addition to the indicators reviewed in your video do you ever employ other indicators outside mt4
Thanks Pipbear
Good work…. Very well understood
Which is your best indicator?
Any luck with volume indicators?