

As you know, the market is prone to the same physical laws as the rest of the world around us. When “cooling down”, the price ceases to form natural barriers, as a result of which the course does not feel strong resistance when moving to either side. When “heating”, the price forms a solid emphasis, which is much more difficult to overcome.
Some time ago based on these preconditions, the idea to create a special indicator, which would in real-time display cold and hot price flows, matured.
Table of Contents
Characteristics of the indicator
- Platform: MetaTrader4
- Currency pairs: any
- Timeframe: any, preferably M1
- Trading time: European and American sessions
- Indicator type: tick volumes
The main idea
It’s not a secret that horizontal levels play an important role in the market analysis. Anyway, almost any trading system takes levels into account, even if the main signal is fed by a certain technical indicator or by using a fundamental component.
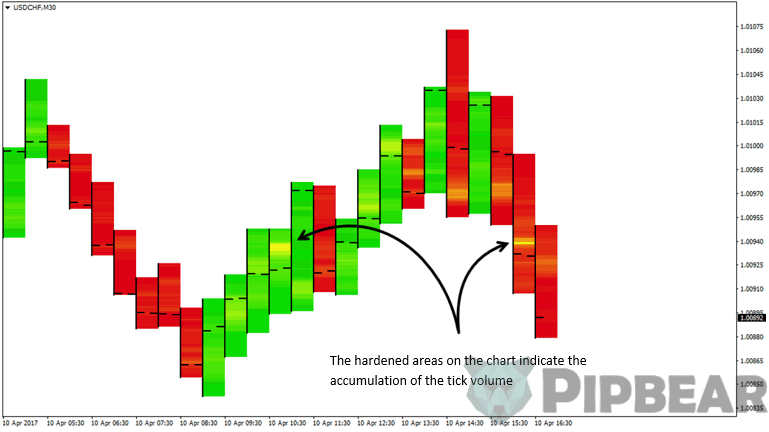
The indicator itself shows on the chart at which levels the largest tick volume was observed. In the preset spectra, the yellow color indicates the highest temperature. That is, the closer to the yellow color, the greater the value of the tick volume at a specific price level.
The indicator is perfect for scalping strategies, where traditional “broad” levels are not that appropriate. A short-term key level can be formed during one candlestick. In this case, the repeated level confirmation only amplifies the signal.
By default, the tick volume is taken from the minute timeframe, but you can specify any other TF. Also, the indicator has several display settings for more convenient information perception.
Indicator settings
In general, the indicator does not require adjustment as such, since the calculation algorithm in the root is very simple. However, several parameters can affect the visual display of temperature.
- MaxMinVolume_AllCandles – this parameter affects the way the maximum volume is calculated. “True” – the maximum values are calculated based on all candlesticks participating in rendering (SumBars). Note that this parameter is only suitable for analyzing volumes on history, because, when a new bar appears, the old values will be recalculated. “False” – the maximum volume value is calculated based on a separate bar. The past indicator values are not redrawn;
- CandleShadow – temperature display only on the candlestick shadows. Useful for analyzing the bounces off levels;
- CandleBody – temperature display only on candle bodies. Useful for analyzing the breakdown levels;
- BullSpectrum – choosing of the spectrum of the bullish candlesticks;
- BearSpectrum – choosing of the spectrum of the bearish candlesticks (you can choose one spectrum for candlesticks of any type);
- draws – the size of the candlestick cell (in pips);
- VolumeTf – the initial timeframe for calculations. To obtain a more accurate result, it is desirable to leave the smallest possible TF (minute);
- numbers – the number of candlesticks to display on the chart.
Tips for use
You can determine for yourself how to interpret the signals sent by the indicator. The main thing is to understand the peculiarity of the tick volumes analysis. With the help of the indicator, you can determine at which levels the trade was most active. Naturally, it will not be possible to determine how much currency was traded.
First of all, pay attention to the accumulation of volumes at specific price levels. The more repetitions, the stronger the level in question.

Also, try not to think out for yourself, focusing only on the yellow shade of the candlestick. At times, the price moves evenly, resulting in no accumulation of volumes at a particular level.

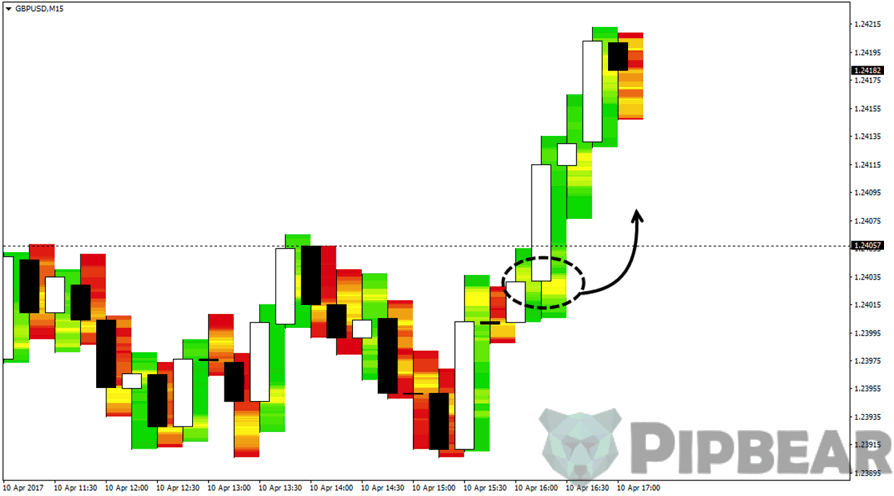
The main advantage of the indicator in its universality and clear short-term signals. The signals can be used both to determine new levels and to confirm the breakdown of the old ones. In the example below, we see how the price “warms up” for a while under the resistance level, after which it overcomes without delays.
Conclusion
In conclusion, I would like to clarify one point: It is not worth taking the indicator values as an accurate signal to the action. The indicator can become an excellent assistant in daily trading, specifically, to simplify the identification of key levels and, in particular, for scalping. Nevertheless, the opening of a trade must be supported by other signals.


First time I’ve heard any of this important information candle stick temp. Very clear and very well done. Thank you!
Hello, Thank you for a great video. Im a beginner and Im wondering what time frame you use for these patterns
Hey man do you teach ? How much would it cost to join a group of people you mentor ? That is if you are mentoring
very educational and conscise.. thanks for sharing!
I REALLY like the way you teach, i have like 2 weeks in this environment and with this article I learn something
Do you offer signal services?
Concepts well understood
I will be coming back for more of your courses
absolutely crystal clear tanx for sharing