

One of the important conditions for successful trading is the chart analysis, but many traders face a problem: sometimes small price fluctuations distract attention and can lead to errors in the analysis. It is to get clear information about significant changes and major trends, the ZigZag indicator is used.
Before reading the article and writing your questions in the comments section, I recommend to watch this video. It’s not long but covers the biggest part of questions on the topic.
If you were interested in the Elliott wave trading method, you simply could not help but hear about the auxiliary indicator ZigZag, which allows you to make fewer mistakes in the construction of waves, filtering out minor market noise. For example, different traders may not build the build Elliot waves on the same chart in the same way. This is because each person in their way looks at this or that movement. The indicator is used exactly to bring the analysis to the same indicator. ZigZag is the main character of today’s review.

Table of Contents
Appearance of the ZigZag indicator
This indicator operates on a very simple principle – it allocates the most significant higher and lower points of the chart and directly connects them with lines, not taking small fluctuations into account. Due to this, it is possible to consider important market movements without taking into account the noise (a similar principle in the Renko charts). Unlike many other indicators, ZigZag does not predict price behavior in the future, but only points to significant changes in the past. The indicator looks like the line of an angle resembling ZigZag (hence the name), which is placed on the main chart.

Standard ZigZag is most effective in combination with other technical analysis tools, for example, fractals, Bollinger bands, or Elliott wave structure. In addition to the classic version, there are many modifications (which you can find on the forum – see the link at the end of the article), the use of which will help to expand the capabilities of the indicator. Unlike most other technical indicators, ZigZag does not predict further price behavior, but only displays their behavior in the past. Nevertheless, it is certainly an effective tool for assessing the current market position. This tool is present in the composition of almost all popular trading terminals. For example, in MetaTrader 4, it is located in the “Custom Indicators” tab by default.
It is difficult to say who and when invented ZigZag, but one thing is certain: this is one of the eldest indicators, which was first used in the stock market, and later became popular with Forex traders.
Settings
The indicator has only three parameters that are responsible for its calculation:

These parameters make the work of the indicator easy to predict because they determine which maxima and minima ZigZag will take into account. Let’s consider them.
Deviation is the minimum value of the number of points expressed as a percentage between the highs and lows of two neighboring candlesticks to form a vertex or local cavity by the indicator. By default, this value is set to 5%. Thus, price movements equal to 5% or more are marked by the ZigZag line, and small price movements are ignored.
Depth is the minimum of the candlesticks on which ZigZag will not build the second maximum/minimum if the conditions of the first parameter are suitable for the construction to take place.
Backstep is the minimum number of candlesticks between local minima or highs.
You can experiment with the parameters, changing their values. The change will affect the degree of sensitivity of the indicator to the movement of prices. If you reduce the values for the calculation – then the number of local minima and maxima will increase, and accordingly a larger number of lines will be displayed.
ZigZag is constructed as follows. Conditional points are placed on the chart if prices unfold not less than by a given amount. Then these conditional points are connected by straight lines.
If you look at the graph with the markup, everything seems elementary: ZigZag simply searches for extremes and connects them with a line, and we can only buy and sell the pairs according to its signals. In fact, in real-time, the indicator does not give 100% correct opening points, since the last break is redrawn according to the following principle:
- First, the formula looks for the minimum extremum formed within the Depth interval, and fixes it;
- If the price continues to fall, the indicator starts to “move” the line even lower each time the market passes a distance of Deviation or more. Hence, a redraw appears;
- If the price unfolds and begins to grow, the ZigZag indicator leaves the minimum at rest and searches for a local maximum, while again exploring the period consisting of the candlesticks specified in the Depth variable;
- If quotes continue to grow, the maximum begins to get updated until a new local minimum is found;
- Then the cycle repeats till infinity.
Advantages and disadvantages
This indicator is intended for the analysis of price movements with a given amplitude and represents trend lines connecting the main bases and vortexes on the chart. Because ZigZag only depicts the most important reversals and other moments of trend changes, it greatly facilitates the evaluation of charts. Let’s start by highlighting the benefits that this indicator gives us:
- Ability to analyze the most significant trends and eliminate market noise;
- Work at different timeframes;
- Combined work with various tools of technical analysis;
- Effective work with Elliott waves or Fibonacci grids.
When working with Zigzag, it is necessary to take into account that the last segment can vary depending on the changes in the data under consideration. That is why the ZigZag should be used only for analysis of past price changes. Here are the main disadvantages of the indicator:
- The difficulty of forming an objective forecast (some traders interpret differently the same phenomena);
- Often the most recent segment is redrawn when using the standard version of the indicator.
The greatest profit can be made when trading using large timeframes. In this regard, traders should better use long-term timeframes. In the opposite case, the probability of losing trades is growing.
The ways to use the ZigZag indicator
This indicator has many uses: search for support and resistance levels, identification of classical figures of technical analysis, calculation of Elliott waves and the definition of various models such as the Gartley butterflies and others. Let’s deal with each of the directions in order.
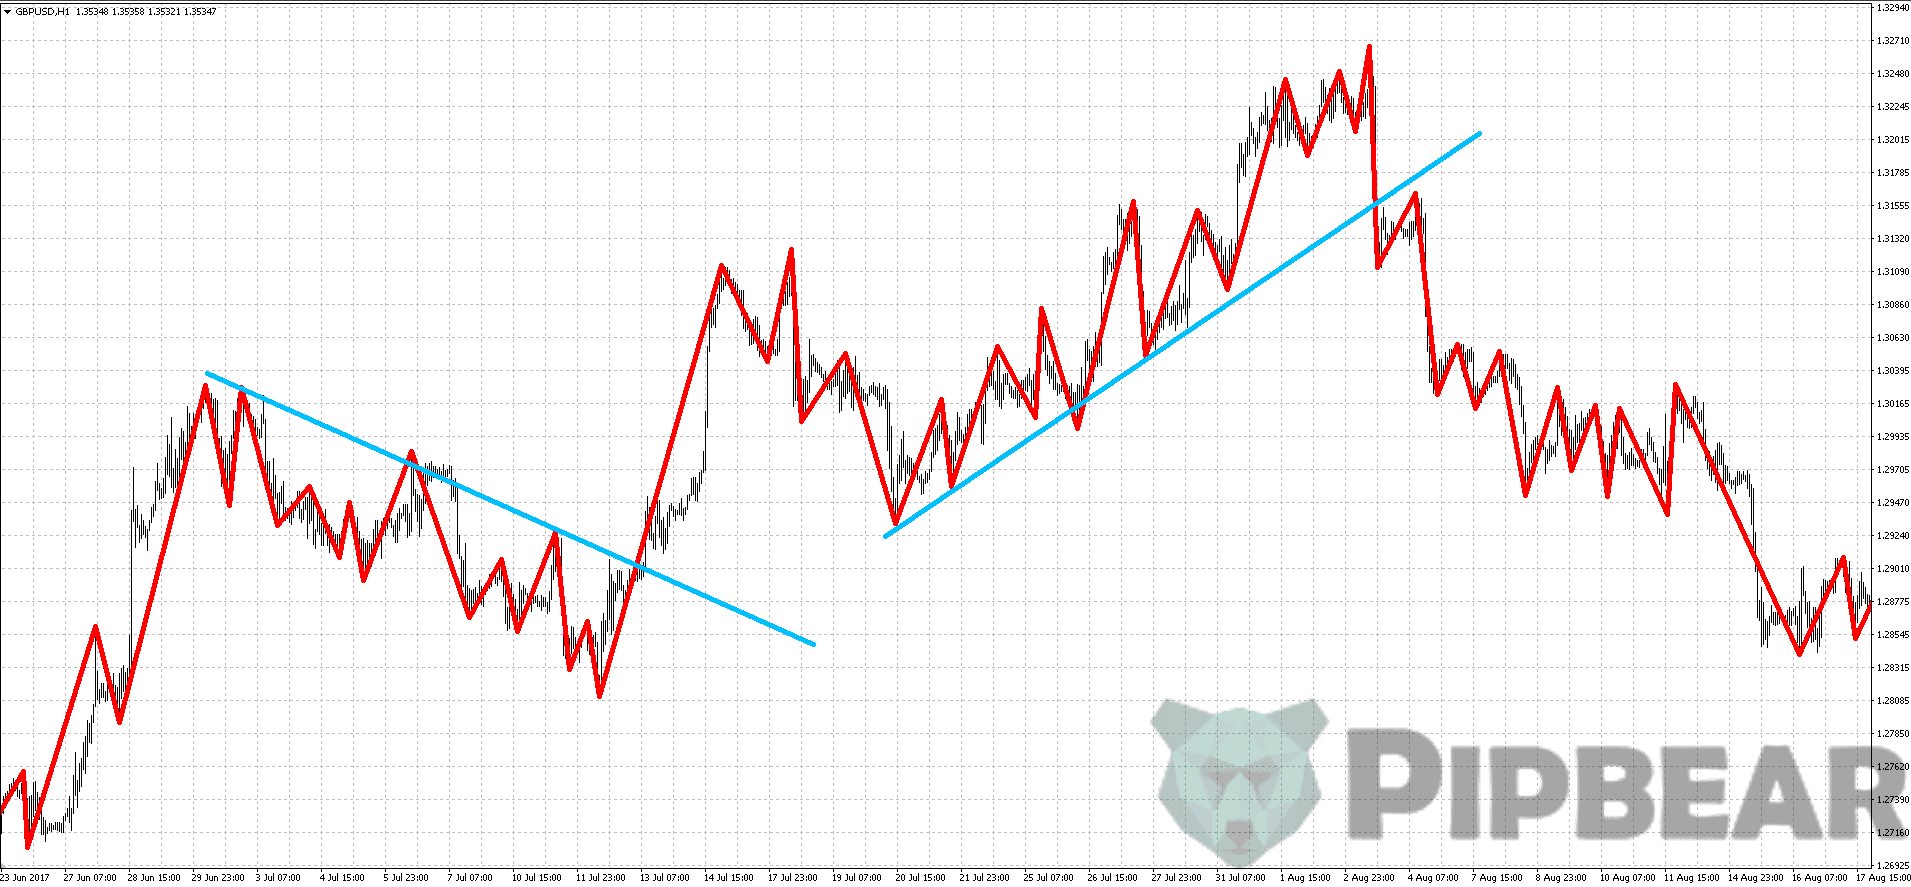
- Defining the trend
If you define the trend direction in your trading in a classic way – through the tops and bottoms, then the ZigZag indicator can seriously simplify this task:

The ZigZag indicator also simplifies the construction of trend lines:
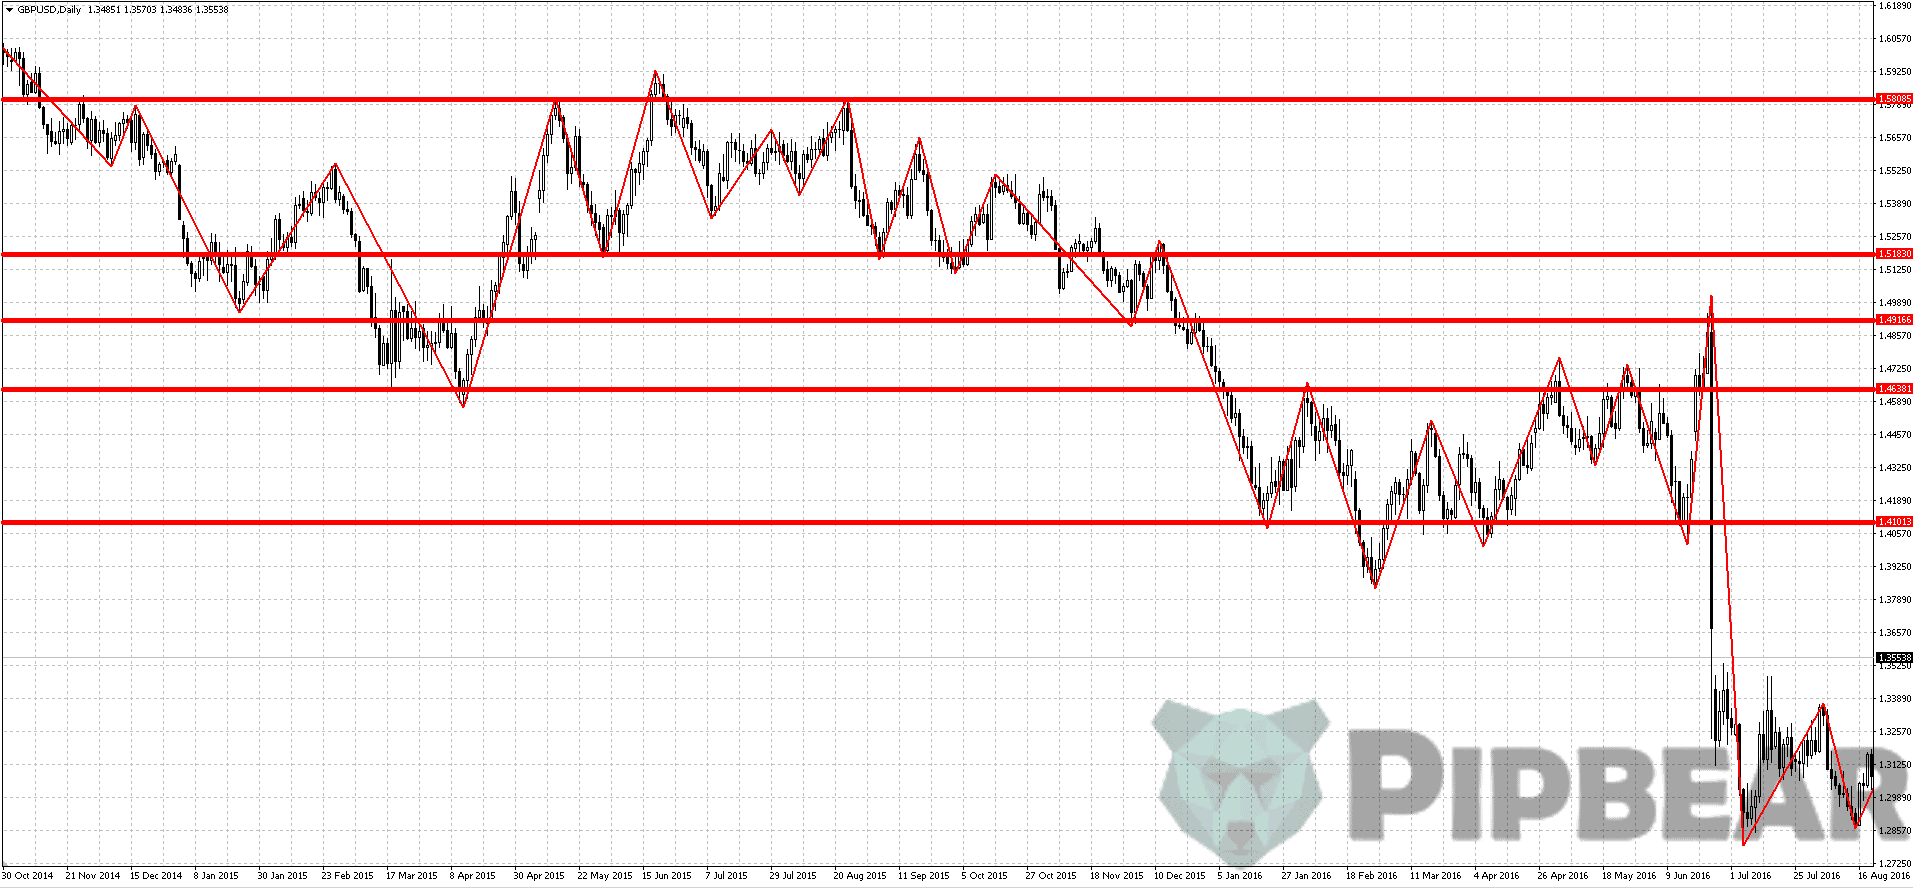
- Convenience of search for support and resistance levels
The chart clearly shows that when pulling the Fibonacci levels, the ZigZag visually shows the repulsion from the important price levels:
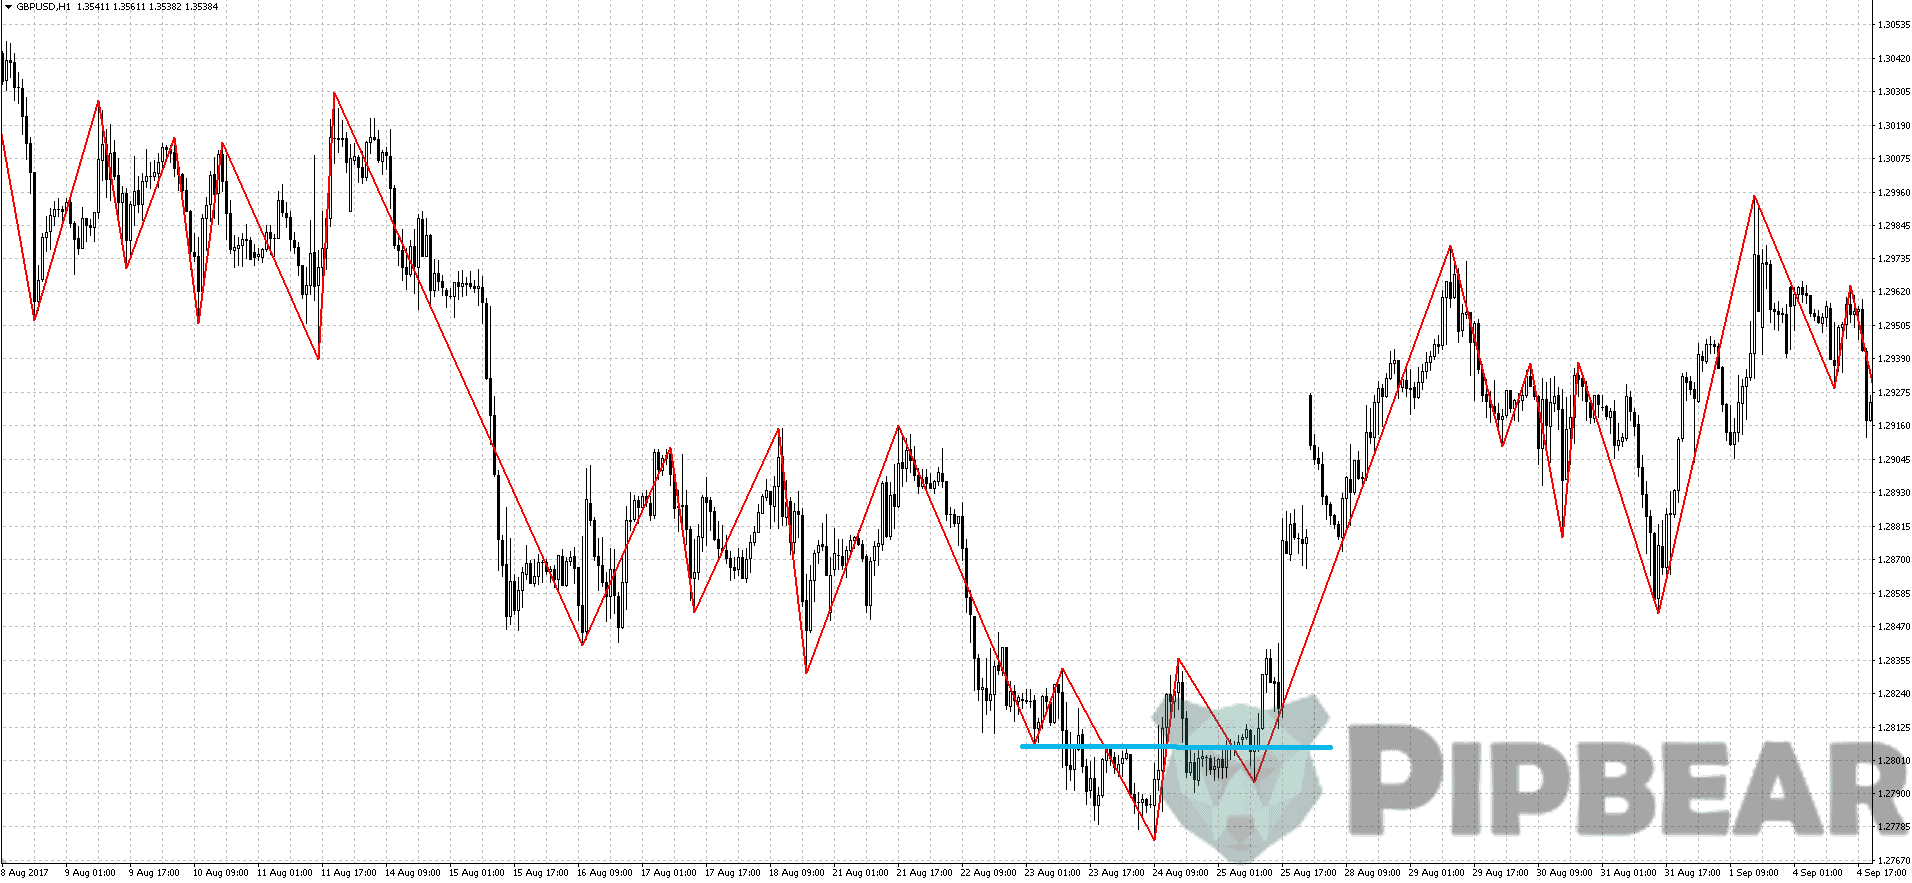
It is also quite convenient to determine the level of the stop using ZigZag in case you use the following trend-following systems:

- Measuring recovery
And again, let’s talk about trading on the trend. As you know, the price in the trend moves with waves, constantly rolling back after each new update of local extremes. Experienced traders often tend to enter the direction of the developing trend on these very pullbacks. To understand when it is time to enter the position, different tools are used. Many traders use oscillators, but quite a few traders are measuring the strength of the rollback with Fibonacci levels:
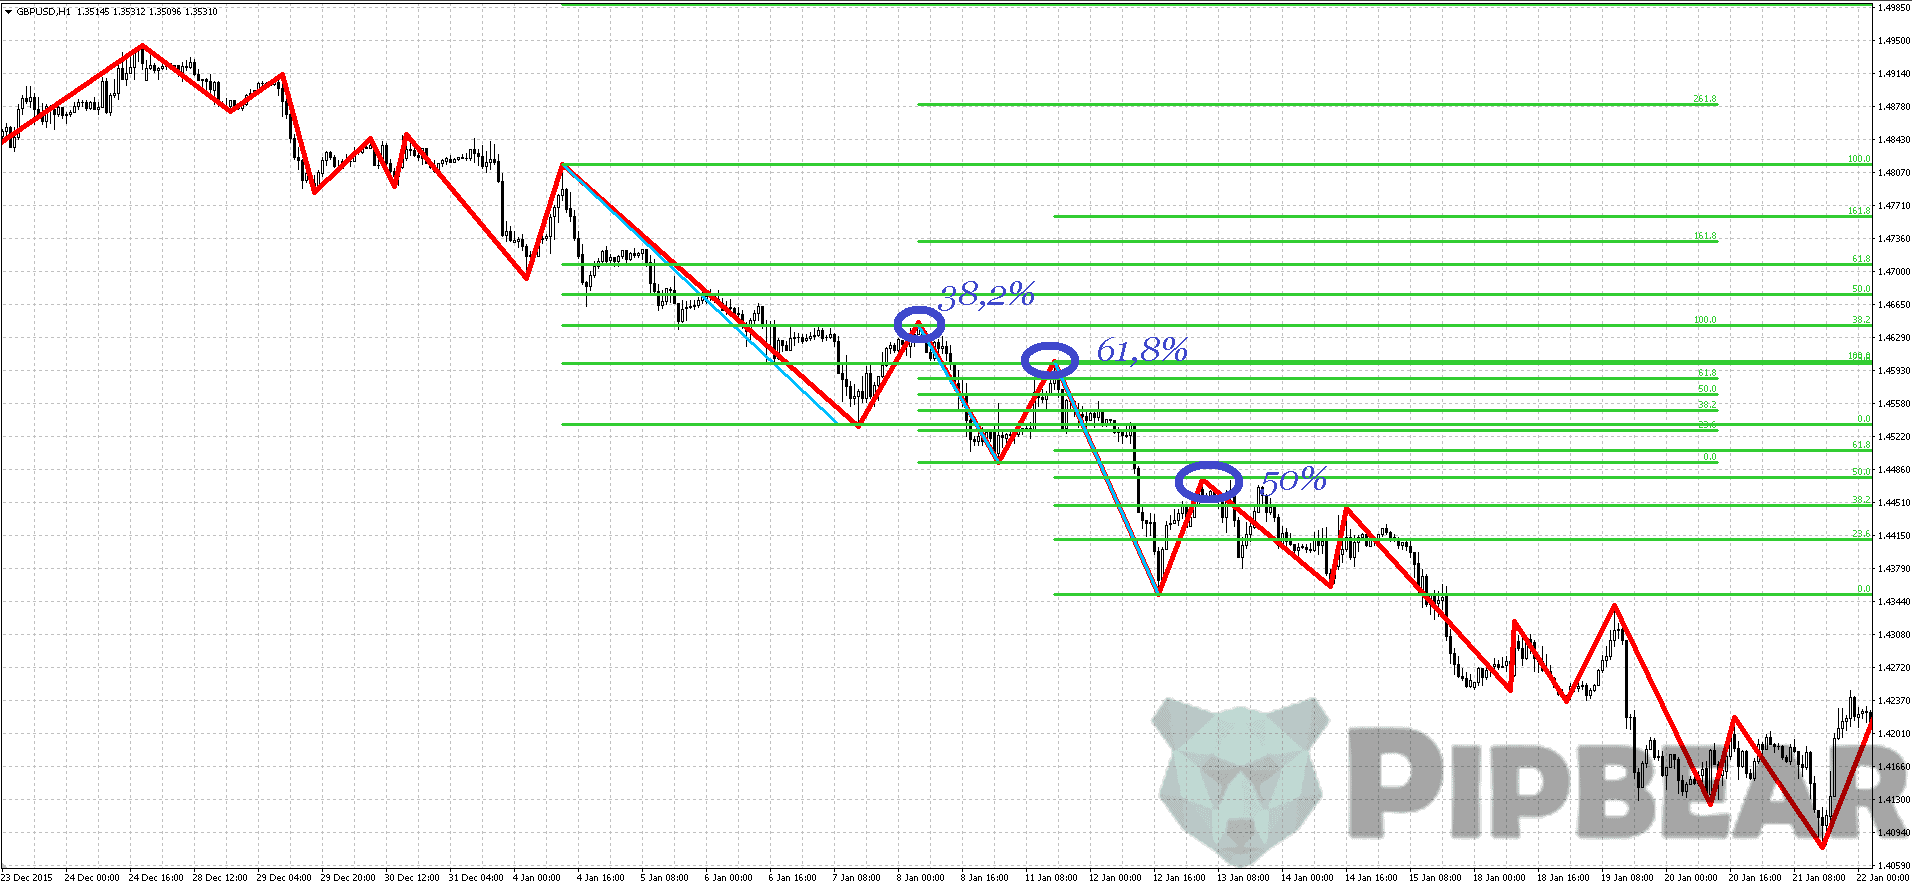
In fact, in combination with the ZigZag indicator, Fibonacci levels provide a very good visual method for determining the end of a rollback in a trend. As a rule, the rollback is completed at the levels 38.2, 50 or 61.8%. And to improve accuracy, you can apply the oscillator as an additional confirmation.
- The best identification of classic figures of technical analysis
The chart below clearly shows how the indicator helps to identify the figures of classical technical analysis. For example, here are flags:

Or, here is the head and shoulders:
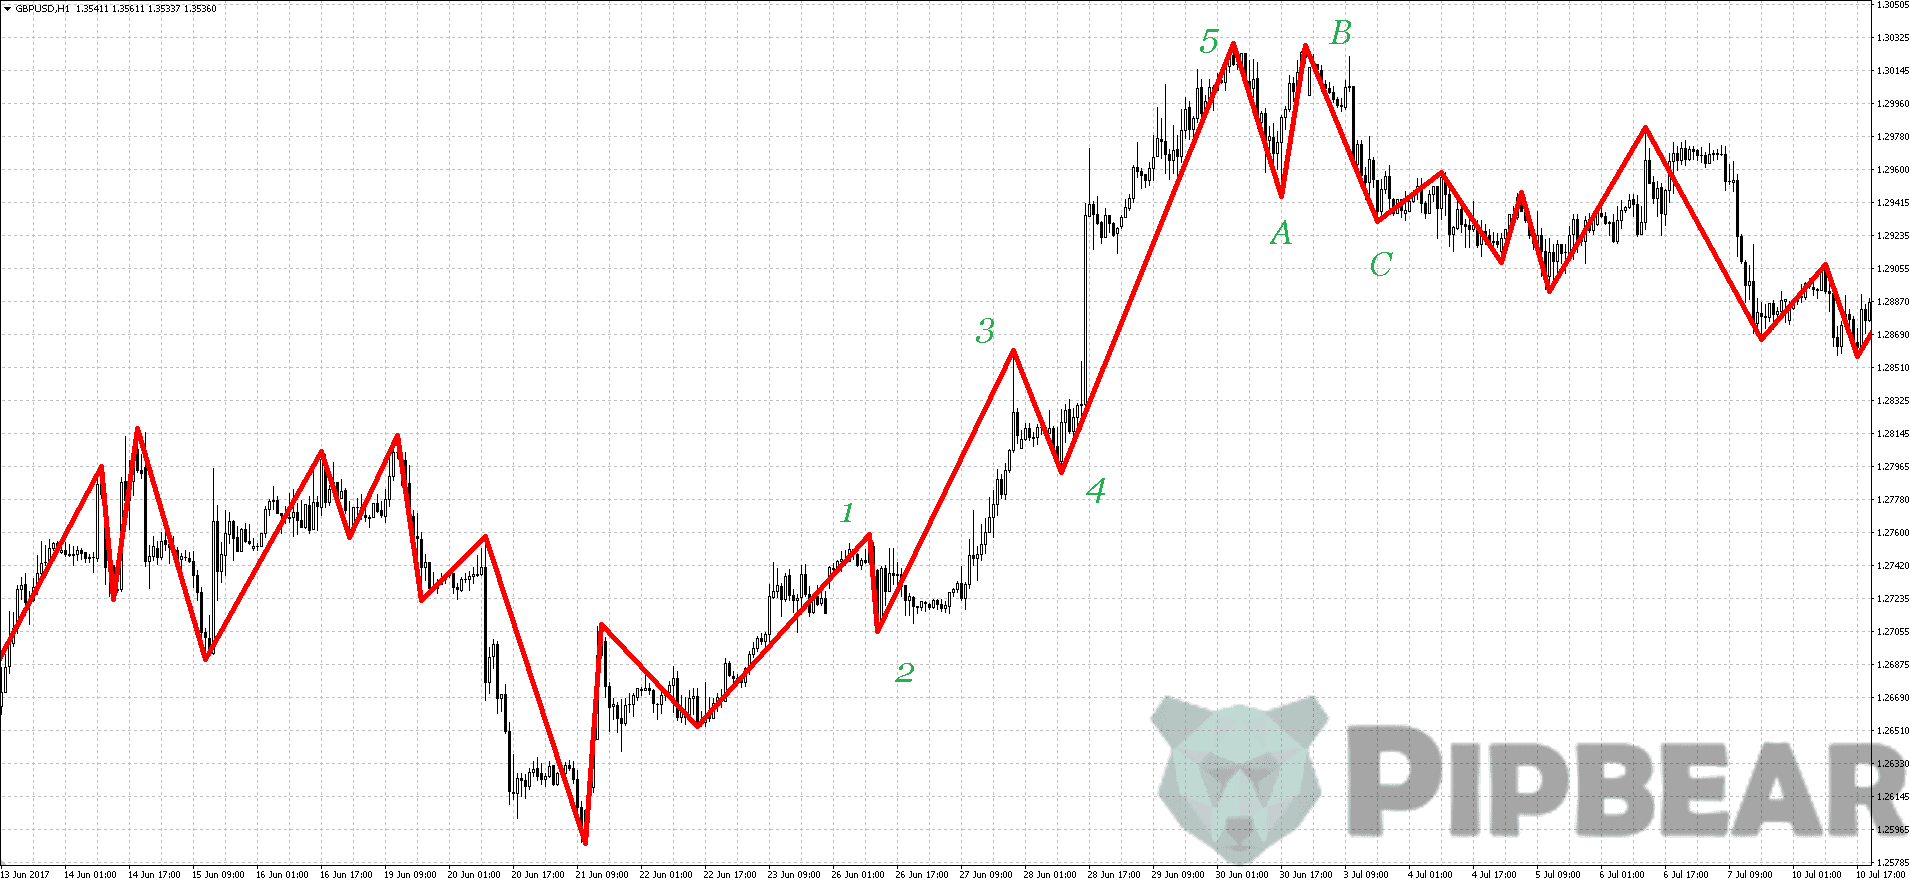
- Convenience and visibility when counting Elliott waves
The law of Elliott waves is rightfully considered one of the best tools for analyzing the state of the market and predicting its behavior. Elliott wave theory is based on a constant cyclical pattern in human psychology.
- Defining the harmonic patterns
Here is, for example, the Gartley butterfly:
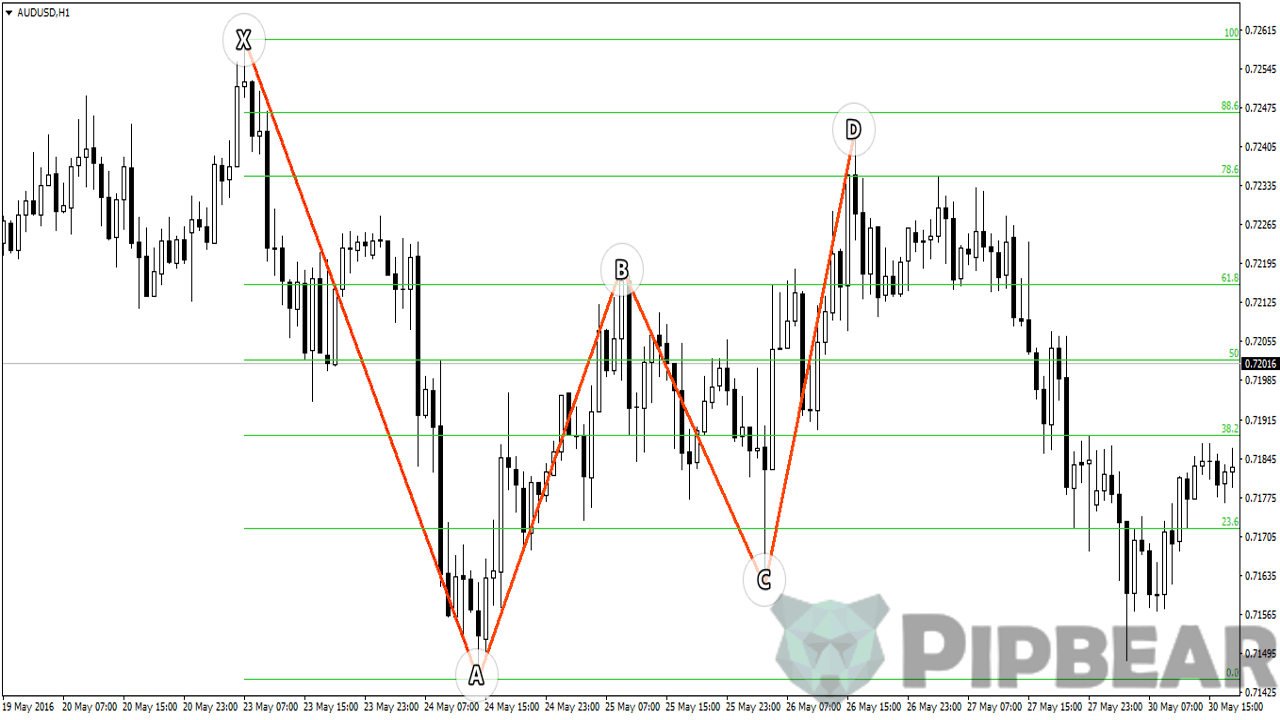
You can find more information on the harmonic patterns in this article. The indicator will also help to work with simpler patterns, for example, with a 1-2-3 pattern.
ZigZag and Bollinger Bands
The ZigZag indicator works very well with a channel indicator such as Bollinger Bands:

As we can see, the combination of these indicators makes it possible to more clearly present information on the current structure of price movements.
The ZigZag indicator, as we have seen above, perfectly allows you to do two things: To show the formation of a new Elliott wave and to determine the trend of the currency instrument. Therefore, in trend strategies based on indicators, the ZigZag is always used as a tool for determining the trend. It does not participate in the search for signals to open or close a position, but depending on its readings, the trader searches for signals to buy or sell. If you meet strategies where the ZigZag indicator is used differently, you should know that such an application ultimately conflicts with the ZigZag tasks. Also, the most appropriate use of zigzags is at large timeframes, ranging from 1 hour and more.
Conclusion
ZigZag is not able to predict the price movement and conducts the lines based on the actual movement. This indicator, as we have seen above, perfectly allows you to do two things: To show the formation of a new Elliott wave and to determine the trend of the currency instrument. With its help, you can filter out the noise and avoid the premature opening of trades. Therefore, in trend strategies based on indicators, the ZigZag is always used as a tool for determining the trend.
It is very popular with traders who work with Elliott theory because it allows you to identify waves without drawing them by hand. Clear lines of the indicator helps to determine the patterns which are formed on the chart, for example, such as the Gartley butterfly.


Looks like an effective strategy, looking forward to learning more about it.
zig zag is the best indicator eveeeeerrr
This indicator is a true life saver…… I Started off losing so much, I learnt the zig zag it has made me profitable
Where do I get the indicator?
Hey, the explanation was concise and helpful so thank you
Nobody else makes the point clearlike you do. Can’t use the ZZ without understanding that. Thx
Thanks bro… good job there
What can I use with zigzag,,, I mean other indicators