

As a standalone technical analysis method, candlestick models emerged as early as the 19th century and have been successfully used ever since. An engulfing pattern is a reversal candlestick pattern that indicates that the current trend is changing its direction. Luckily for traders, an engulfing pattern is easy to recognize on a chart. If you interpret the pattern correctly, you have all chances to enter the market at the very beginning of a trend or retracement. So how does this amazing pattern work?
Before reading the article and writing your questions in the comments section, I recommend to watch this video. It’s not long but covers the biggest part of questions on the topic.
What is an engulfing pattern?
An engulfing pattern consists of two opposite candlesticks that emerge at local extreme points after a trend.
The first candle has a relatively short body compared to the second candle. The second candle overlaps or engulfs (hence the name) the body of the first candle. Depending on the direction of a trend, an engulfing pattern comes in bullish or bearish variations. Let’s find out how an engulfing candle looks on a chart.

On the Н4 chart for AUD/USD you can see that an uptrend started with an engulfing pattern. That event was preceded by a continuous downtrend with a minor retracement. An uptrend formed at the same time as a Double Bottom pattern that acted as confirmation for the bullish engulfing pattern. As you can see from the chart, the engulfing candle goes beyond the body of the previous candle.
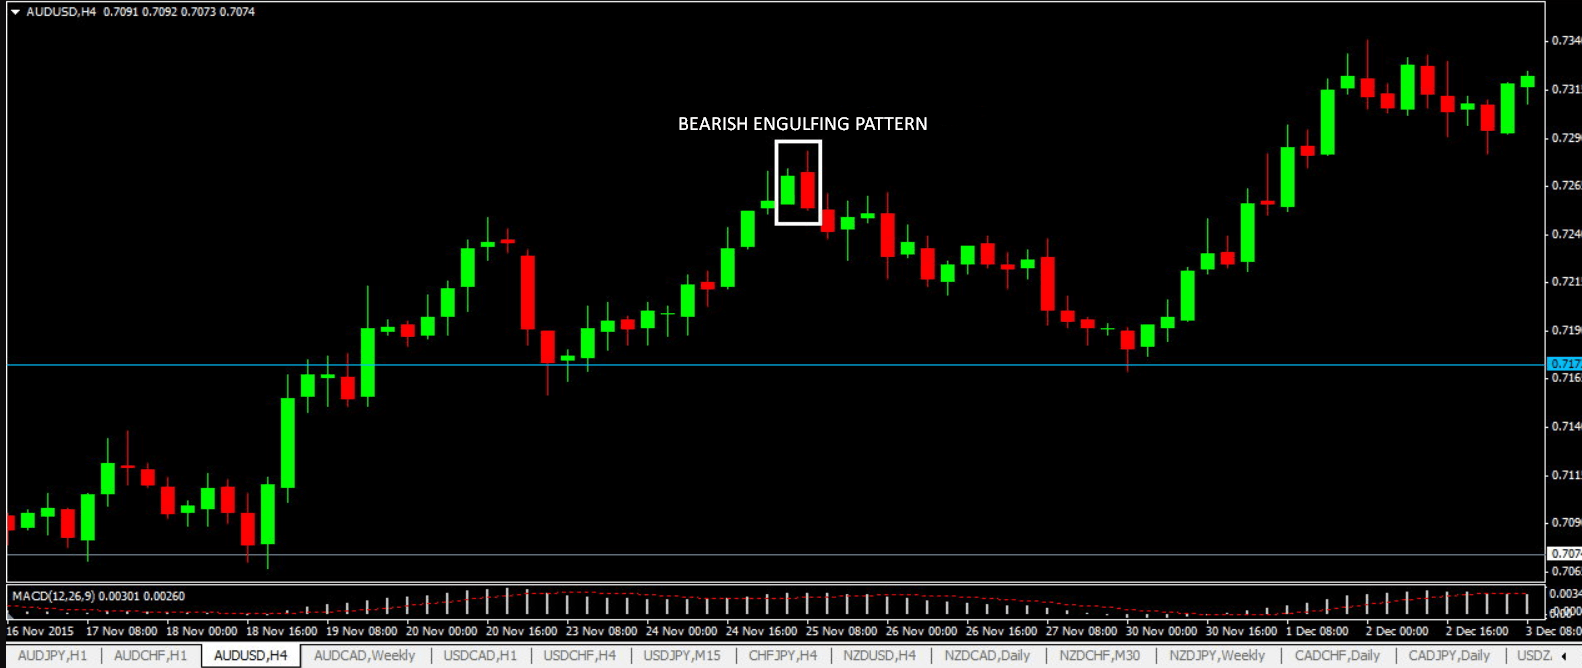
On the chart above, you can see a bearish engulfing candle, following which a price returned to the nearest local low and continued to move with the trend. Following a strong growth, an outside bar formed, with the closing price lower than the opening price of the previous candle. This was an indication of a downtrend.
How to correctly identify an engulfing pattern
Using an outside bar on its own as an entry signal is too risky. A pattern can be considered trustworthy if:
- It forms within a trend;
- Its candles have different directions;
- It’s confirmed by other technical indicators.
If a price is moving sideways, there is no use looking for an engulfing pattern on a chart. This pattern only forms at local extreme points that follow a strong trend movement.
If the market opens with a gap, an engulfing pattern may consist of two same-direction candles. This is a false pattern and shouldn’t be traded even if the two other conditions are met.
Before opening a trade, be sure to wait for confirmation. This may be a signal from an indicator or graphic model that formed near the engulfing pattern. However, if an outside bar occurred at a swing high or swing low, you can enter the market without second thoughts.

Other confirmation signals for entry include an engulfing model that formed at a support/resistance level, double/triple bottom/top, price rebound from a psychological level (price level that ends in 00 or 50).
If an engulfing pattern occurred on several timeframes at the same time, there is a high chance that it will play out just fine. Don’t trust engulfing patterns on very low timeframes with an abundance of false signals.
Engulfing indicator as a fast method for identifying candlestick patterns
While a consummate trader can recognize all candlestick patterns with one eye closed, a novice trader may easily overlook some important signals. This is where the Japan indicator comes in. It can be a great help in searching for engulfing patterns. The indicator marks engulfing patterns with a square accompanied by a number. To find out the name of a graphic model, point the cursor at its square. This is how it looks on a chart:
As you can see from the EUR/GBR chart, a bearish engulfing pattern signals the weakening of an uptrend and the beginning of a downtrend. All the entry conditions have been met: an engulfing model consisting of two opposite candles occurred at a local swing high.
Along with bearish and bullish engulfing patterns, the Japan indicator can recognize two more candlestick formations, Piercing Pattern and Dark Cloud Cover. There is no such thing as an ideal trading indicator, and the Japan indicator is no exception. First, you shouldn’t use it on its own. Second, it identifies patterns without saying how reliable they are.
By using an engulfing pattern, you have all chances to enter the market at the right time and make the most of an emerging trend.


