

This article is looking at the trading methods developed by W.D. Gann, a trader with an extraordinary personality. He designed a new approach to predicting market behavior using several disciplines, including geometry, astrology, astronomy, and ancient mathematics. They say that not long before his death, Gann developed a unique trading system. However, he preferred not to make his invention public or share it with anyone.
Before reading the article and writing your questions in the comments section, I recommend to watch this video. It’s not long but covers the biggest part of questions on the topic.
We only have a small part of the William Gann methodology which is of great interest to traders and analysts all over the world. The peculiar thing about these methods is that they involve searching for mathematical patterns and detecting financial market cycles. Gann was the first to identify repeating price cycles and discover the link between price and time. Throughout this trading career, Gann earned more than 2 million dollars. In this article, we’ll cover the mystical Square of Nine. Plus, we’ll find out how the Gannzilla tool can help you analyze the market and make calculations in a faster and easier way.
Table of Contents
What is Square of 9
Gann Square includes two sets of numbers. The first set is also called a wheel. In it, numbers are arranged in a spiral form, with their values increasing clockwise. Each number stands for an angle relative to the center. In the second set, numbers are arranged on a plane. The classical Square of 9 comes in two types:
- Diagonal;
- Cyclical.
How to build the cyclical Square of 9
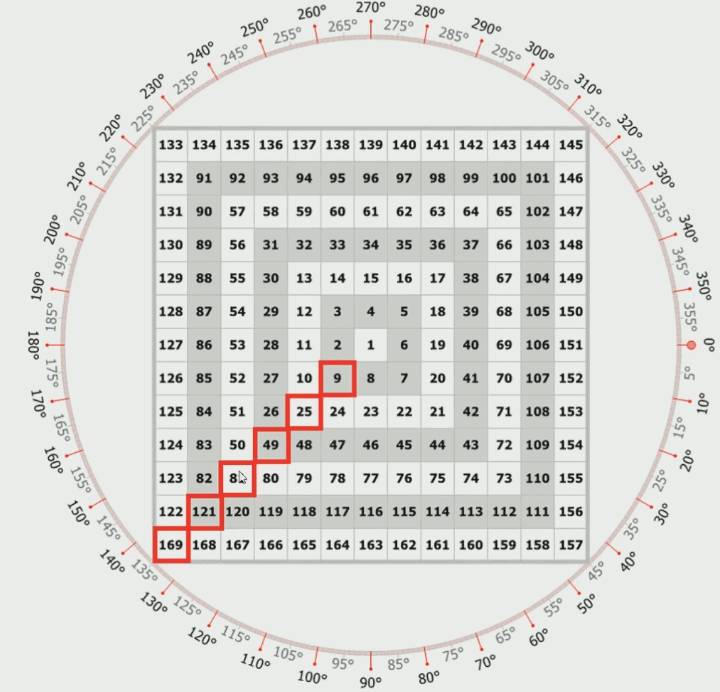
Number increase as we move from the center in a clockwise direction. To make a full rotation, we need to make a 360-degree circle moving from one cell to another (e.g., from 26 to 49, from 82 to 121, etc.).

Squares of odd numbers can be found in the lower-left corner of each rotation circle (3×3=9, 5×5=25, 7×7=49, 9×9=81, 11×11=121, 13×13=169, etc.). This is why the Gann Square is called Square of 9: if you make a full rotation, you’ll get 9 (three squared).
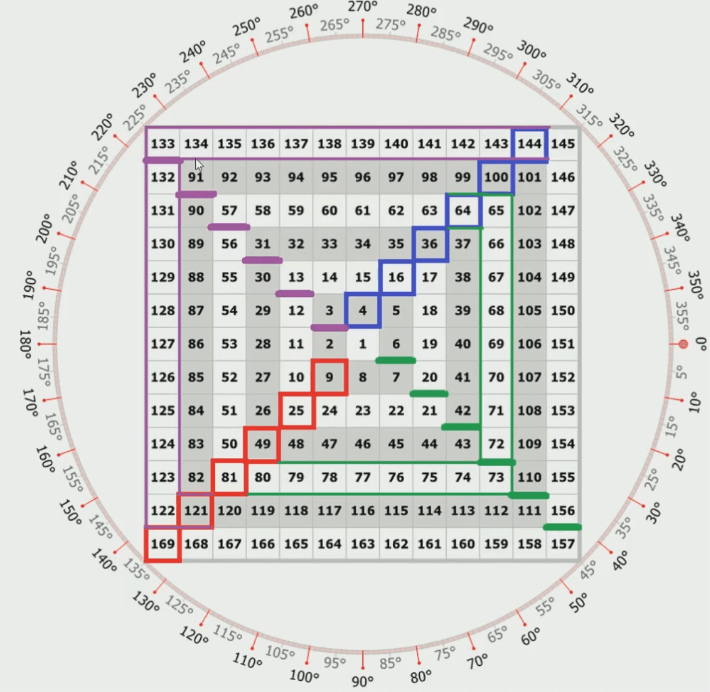
The squares of even numbers are found above the right upper diagonal at 315° (2×2=4, 4×4=16, 6×6=36, 8×8=64, 10×10=100, 12×12=144, etc.). If you see a high/low in one of these cells, there is a high chance that the same formation (or its mirror reflection) will repeat in one rotation. This rule also applies to squares of odd numbers.

Now let’s examine the upper left and lower right diagonal lines. These lines represent a half of a rotation circle when we move from squares of odd numbers to squares of even numbers (upper left diagonal) and from squares of even numbers to squares of odd numbers (lower right diagonal). Sounds too confusing? Let’s break it down by taking an example. We move from the square of an even number to the square of an odd number, e.g. from 16 to 25. We make the calculations: (16+25)/2=20.5. The problem with fractional numbers is that there is a high chance of an error. It all depends on your accuracy and concentration. Now we move from the square of an odd number to the square of an even number, e.g. from 121 to 144. Again, we make the calculations: (121+144)/2=132.5. As you’ve probably noticed, our calculated numbers can be found near the diagonal lines at 225°, 315°, 45°, and 135°.
You may be wondering why we’ve made these calculations in the first place. The thing is, halfway between the squares of even and odd numbers, a minor extreme point may form on a chart. While there are significant highs and lows where a price stops trending and starts to move sideways or reverses, there also are less important extreme points that indicate the beginning or end of a retracement. There is a possibility that such minor extreme points may correspond to these values.
Before analyzing a chart, we need to make a few more calculations. Now we’ll focus on quaternary numbers (¼ and ¾ of a rotation circle, from odd to even and from even to odd). For example, we move from 121 to 144. We’ll make 3 stops on our way: ¼ of a circle – 121+(144-121)/4=126.75; ½ of a circle – 133; ¾ of a circle – 121+(144-121)/4×3=138.25. If we make a full rotation, we land on 144.

Now let’s move from the square of an even number to the square of an odd number, e.g. from 64 to 81. We’ll make 3 stops on our way: ¼ of a circle – 64+(81-44)/4=68.25; ½ of a circle – 72; ¾ of a circle – 64+(81-64)/4×3=76.75. If we make a full rotation, we land on 81. As a result, our Square of 9 will look like this:

Keep in mind that fractional numbers may land not only in the center of a cell but also between cells.
Let’s take a look at what we have. We switched from a cyclical to diagonal Gann Square, adjusting it for further chart analysis. Now our Square of 9 consists of crosses:

The diagonal cross consists of the squares of odd numbers and cells that are close to the squares of even numbers. Cardinal cross includes numbers that are close to ¼ and ¾ of a rotation circle. If you put the initial value (price high/low) into the center of the square, you’ll be able to predict significant market events long before they occur. This price prediction method fits both long-term and short-term trading. At the same time, it’s important to remember that using fundamental analysis is always a better idea than using technical tools, however accurate they were.
Overlaying
- Angles. You can rotate angles depending on the market situation and your goals;

- Triangle. While triangles provide practically the same values as angles, they’re easier to count for some traders than angles. If you’re using the Gannzilla software, you won’t have any trouble plotting both triangles and angles on your Square.

- Quadrangle. When overlaying a geometric shape on Square of 9, you can use both the degree circle and cell centers for orientation. In the image below, we overlaid a quadrangle by using each of these methods. As you can see, the images look identical but have different orientation systems. In the first image, we use a 120° mark for orientation. In the second image, we use the center of cell 119 for orientation. The choice of an orientation method depends on the situation.

Pivot points
Now let’s analyze the chart. First, we need to identify the pivot points. We’ll be using these pivot points to predict where such points may occur in the future based on the current price fluctuations. It’s important to understand that the market situation can’t change in a nick of time. Large players are entering the market slowly, one by one. This is why the market may still follow some of its previous patterns. According to William Gann, the best indicator for price behavior is how it behaved in the recent past.

How to calculate the Square of 9
Now that we have the basic idea of the Square of 9, we need to learn how to use our knowledge in real life. We need to see what these numbers mean in terms of trading. You can choose from 6 calculation methods using:
- cell numbers;
- overlaying and cell numbers;
- overlaying and two pivot point dates;
- progression;
- progression and overlaying;
- regression and overlaying.
As price and time are calculated separately, we get a total of 12 calculation methods. Furthermore, if we use two types of time (continuous and discontinuous), we end up with 24 methods! Normally, we use discontinuous time (when only business days are taken into account) in Square 9 calculations, while continuous time is used for long-term projects (over 1 year). For convenience, in this article we’ll be using discontinuous time.
How to calculate the Gann Angle for medium-term trading
According to Gann, different trading tools move differently and have unique features. However, all of them aim to reach a certain value. If we apply this information to Square of 9, we’ll see that prices and dates of pivot points are arranged along a certain angle on the wheel. Sometimes, there may be two of such angles.
Let’s take an example. Suppose, there was a downtrend that reversed into an uptrend. On a chart, we plot four points that mark the first vibration at the beginning of a trend. The X-coordinates of these points stand for time. The Y-coordinates of these points stand for the price. Using these eight values, we’ll try to predict how a price will behave in the future. Let’s enumerate the points. Usually, Point 1 is used as the origin; Point 2 is used for orientation; Points 3 and 4 are used for angles. Then we plot the Gann Square and mark the points on it. Point 1 is in the center. Point 2, which is higher than Point 1, lands in cell 21. Point 3, which is lower than Point 2 but higher than Point 1, lands in cell 18. Point 4, which is the highest of all the four points, lands in cell 27. Now we need to use the center of cell 21 to orientate the wheel:

The next step is to choose a geometric shape to lay over the square. This shape will go through Point 3 or Point 4. Let’s take a triangle. If you can’t find the geometric shape that would go through Point 3 or Point 4, you must have incorrect points.

We’ve got a 120° angle. Now we need to plot the numbers of cells 52, 85 and 125 on the chart. First, we need to build a square to identify trading days when the key trend reversals will occur. Then we need to build the Gann Square with price levels. Trend reversals can be characterized by two parameters: price or time. The best reversals are the ones characterized by both price and time. Keep in mind that you only get reversal points but there is no way of knowing whether those are lows or highs. Another thing to remember is that with each new rotation, the distance between levels increases both in terms of price and time. When a price no longer stops at your calculated values, the Square of 9 model becomes useless.
Types of signals
- Price breakout;
- Price rebound;
- Time rebound;
- Price and time rebound (the highest chance of rebound).
How to deal with fractional numbers
There is a rule that says that all fractional numbers over 0.5 land in the next cell. Working with fractional numbers requires concentration. If you fail to correctly arrange fractional numbers in cells, your calculations will include an error. We hope you understand the consequences of an incorrectly calculated stop loss, right? However, there is a way to avoid fractional numbers by multiplying a price with 4 digits after the point by 10,000. By the way, if you’re using the Gannzilla software, it works with fractional numbers with up to 4 digits after the point.
Summing it up
The Gann methods have plenty of both advocates and adversaries. The two opposing groups engage in endless discussions about whether Gann’s methods work. There is one thing we know for sure: if Gann were a charlatan, he wouldn’t have earned global recognition and his portrait wouldn’t embellish one of the world’s busiest stock exchanges. William was among the few traders who managed to describe the market using a mathematical formula. Although the Square won’t tell you exactly in what direction a price will go and when, it’ll help you identify the key reversal levels, both in terms of price and time. In the hands of a seasoned trader, the Gann Square will turn into a powerful trading tool. As for novice traders, they may find the Gann methods too confusing. With the Gannzilla tool, even traders with zero trading experience can use the Gann Square to make profits. Good luck with exploring the possibilities of this challenging yet effective trading method!
Source: http://tradelife.ru/squared-gann.html


Onother one month great its 12-2 success ratio wow
Finaly u made a tutorial on gann.
Thanks a lot sir. Excellent description…… Hats off.
Appreciate your help and knowledge sharing that too free, certainly its very useful.
ntastic ….. I really appreciate your teaching style …. loved the tutorial delivery
only gann will not fetch you money, you need to follow diferent stratagies besides gann to be successful in intraday trading
Waste of time and its not easy to trade gann systems. Fibonacci levels are the best.
am expecting comments from those who done his course…… it may positive or negative
Thanks teacher
more thanks