

Non-indicator analysis of Forex is guided by only one judgment: traders will behave equally under equal conditions. This regularity is easily confirmed if we look at the chart history. You can see that the market reacts in a certain way whenever certain patterns appear. It should be noted there are numerous trading patterns on Forex. Among them, special attention should be paid to Gartley butterfly, as there are many varieties of this pattern and this formation is considered to be one of the strongest.
Before reading the article and writing your questions in the comments section, I recommend watching this video. It’s not long but covers the biggest part of questions on the topic.
Table of Contents
Historical background
In the middle of the 20th century, Hardol Gartley was a well-known trader in Wall Street circles. He was highly appreciated as an adviser, educator, founder of security analysts society, and a bachelor in commerce. At that time, his courses were sold at a record high price – $1,500. To better understand how high this rate was – the one could purchase three Ford cars with this amount in the US. Fantastic glory found Harold after the discovery of a new pattern, called after him – “Gartley butterfly”.
It’s quite difficult to trade according to the patterns. Nevertheless, it’s worth it, because the Butterfly pattern is one of the strongest patterns on Forex which pays for itself in most cases. Thus, we should note, Gartley patterns are quite rare to find. It should be also mentioned that it is sometimes not so obvious. But if a trader manages to detect it he should still make the proper marking, which requires plenty of time. If we talk about separating the losses, harmonic Gartley patterns do not prescribe any clear rules on setting Take Profit and Stop Loss values.
Trading method with Gartley patterns
Considering all of the above, let’s examine the trading process in which we’ll be guided by Gartley butterfly. Followers of Harold Gartley have discovered additional alternative harmonic patterns over time. They include “Bat”, “Pesavento butterfly”, “Crab”, etc.
To solve the problem of building on the price charts of Gartley’s formation in the 21st century the availability of Gartley’s butterfly on a certain asset can be checked anytime, using special software. We’ll talk about the ZUP indicator. It can be downloaded below
After the installation, the chart should look as follows:

Figure 1. ZUP indicator on the chart.
Important note: you should consider butterflies and other possible Gartley’s patterns on higher timeframes on Forex (H1-D1). Because the higher the timeframe the stronger the signal is.
How are Gartley’s butterflies built?
“Gartley butterfly” formation is similar to the correction of Elliott waves (ABC). It is built by broken lines of the ZigZag indicator based on Fibonacci level corrections. However, there are still some differences between them:
- Gartley butterfly is formed according to the equality rule of AB and CD waves.
- Fibonacci tool is stretched along the whole XA wave so that B point is located at Fibo 61.8 level, while D point – at 78.6 level.
- SIn such a way we get a technical analysis figure which looks very similar to butterfly wings.
In technical analysis, the “Butterfly” pattern has another one advantage. It’s formed on the utmost pullback point. This allows a Forex trader to take appropriate steps in advance within the further market reversal. In other words, the trader can enter the market at the best price.
It should be stressed once again that Gartley butterfly is the ideal pattern which is quite rare to find. But besides the classic butterfly there are also other harmonic patterns, like “shark”, “crab”, “bat”, etc.
Since the Butterfly pattern requires a pretty long time to be built on Forex independently, we can apply a special Forex indicator. It has been mentioned above.
One of the kinds of Gartley patterns
To understand the signals from Gartley patterns you need to know their varieties. There are the following patterns:

Figure 2. Bullish and bearish “Shark” pattern.
And here is how harmonious 5-0 patterns look like:

Figure 3. Bullish pattern – on the right, bearish pattern – on the left.
Harmonic “Three movements” patterns:
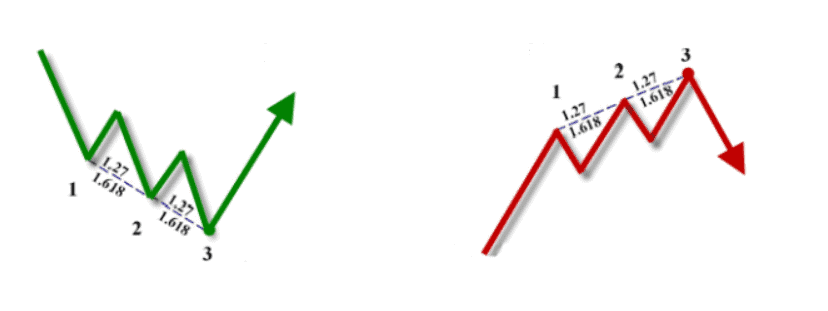
Figure 4. Bullish pattern – on the right, bearish pattern – on the left.
Crab

Figure 5. Crab pattern.
There are also the following kinds of the “Crab” pattern:
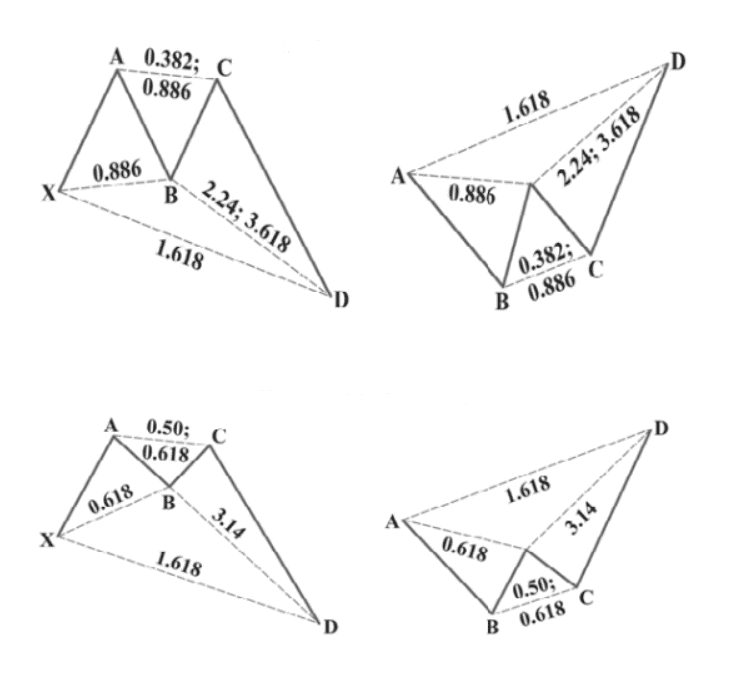
Figure 6. Varieties of the “Crab” pattern.
Bat
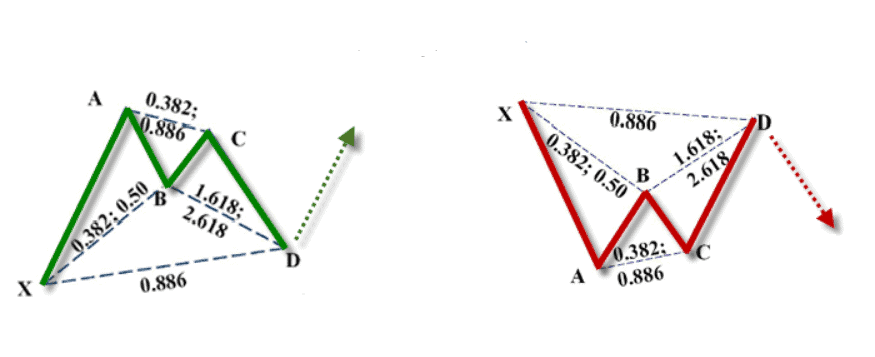
Figure 7. “Bat” pattern.
These varieties should be distinguished from butterfly formations on Forex:
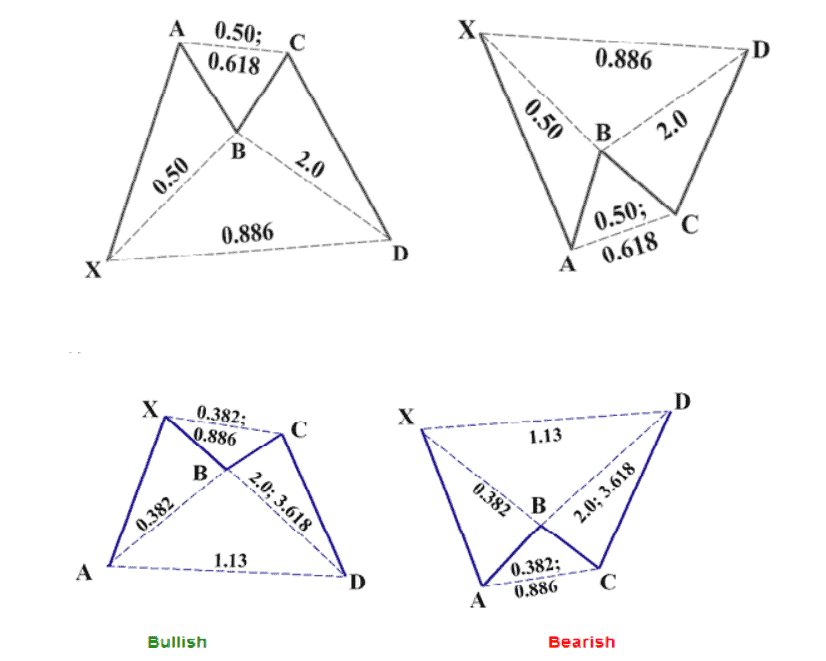
Figure 2. “Bat” pattern variety.
Pesavento butterfly looks like this:

Figure 9. Pesavento butterfly.
Gartley butterfly

Figure 10. Gartley butterfly
Gartley patterns (AB = CD):
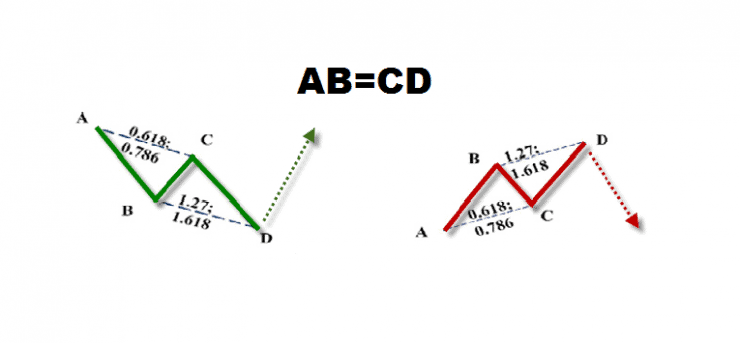
Figure 11. Gartley patterns (AB = CD).
Important note: if a certain Gartley pattern appears on the chart, the ZUP indicator will give a beep sound.
Description of indicator constructing Gartley patterns
If you want to estimate the market situation using the Gartley patterns quickly and get potentially profitable entry points in various assets you’ll need to use the ZUP indicator.
This is an objectively highly accurate trading tool in the Forex market. It has many settings and can automatically detect and highlight different variations of butterflies on the chart.
The use of the ZUP indicator in trading is quite simple. When the “Butterfly” pattern is formed, you need to pay attention to the red rectangle. You can extend a Fibonacci grid in it.
On the screenshot above, we can see a signal from the ZUP indicator on the bullish Gartley pattern (when AB=CD). Now you can search for the entry points based on Fibonacci levels stretched in the red rectangle.
ZUP can be considered as a universal tool since the market initially moves in cycles. Therefore, we can use this indicator with any timeframes (preferably with the higher ones).
Let’s examine the example of the butterfly pattern on Forex:
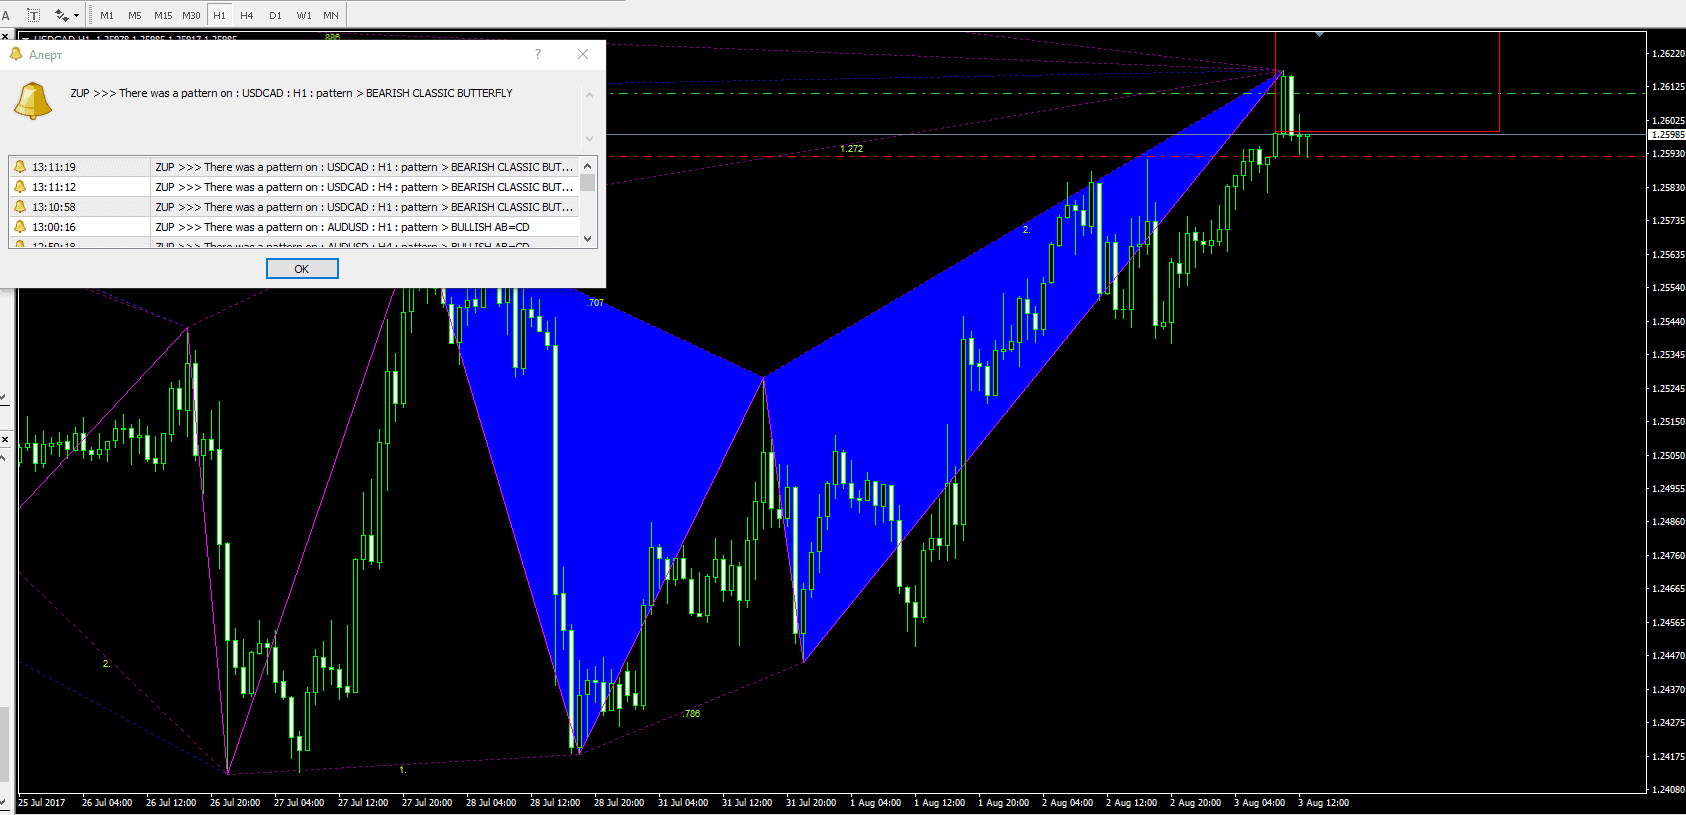
Figure 13. Signal of a bearish classic Gartley butterfly.
If you switch to the H4 timeframe, you can observe the same signal:
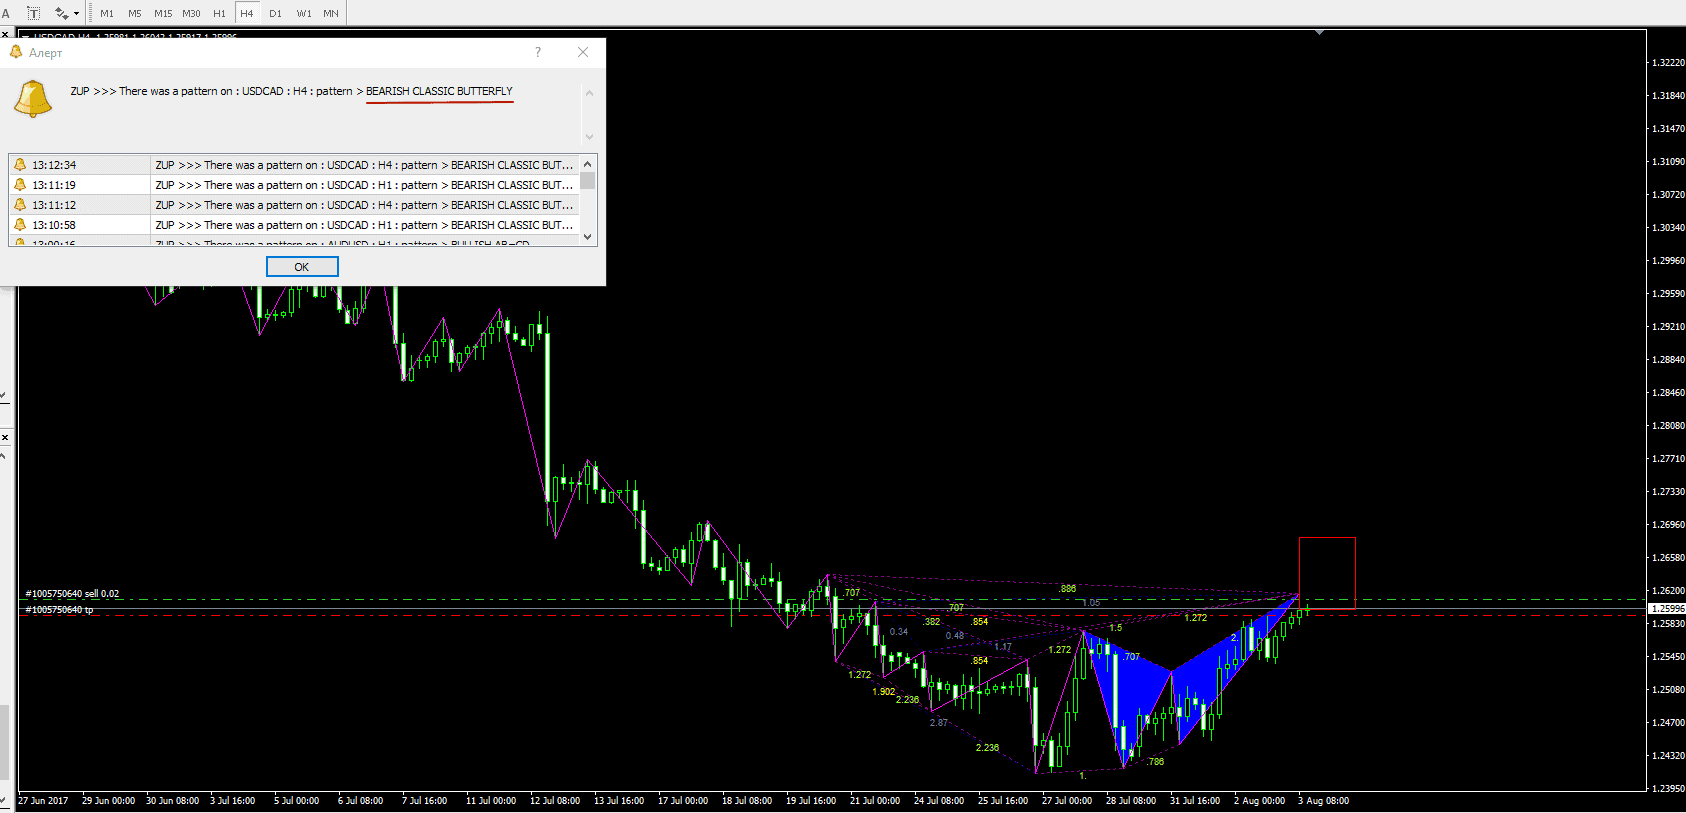
Figure 14. Signal of a bearish classic Gartley butterfly (H4).
Conclusion: since we see a confirmation of the signal of bearish Gartley butterfly pattern on the two higher timeframes, we open a short trade. Our goal is B point. Stop Loss can be moved beyond the red rectangle.
Here’s how the trade of USD/CAD asset several hours after you entered the SELL position has closed.
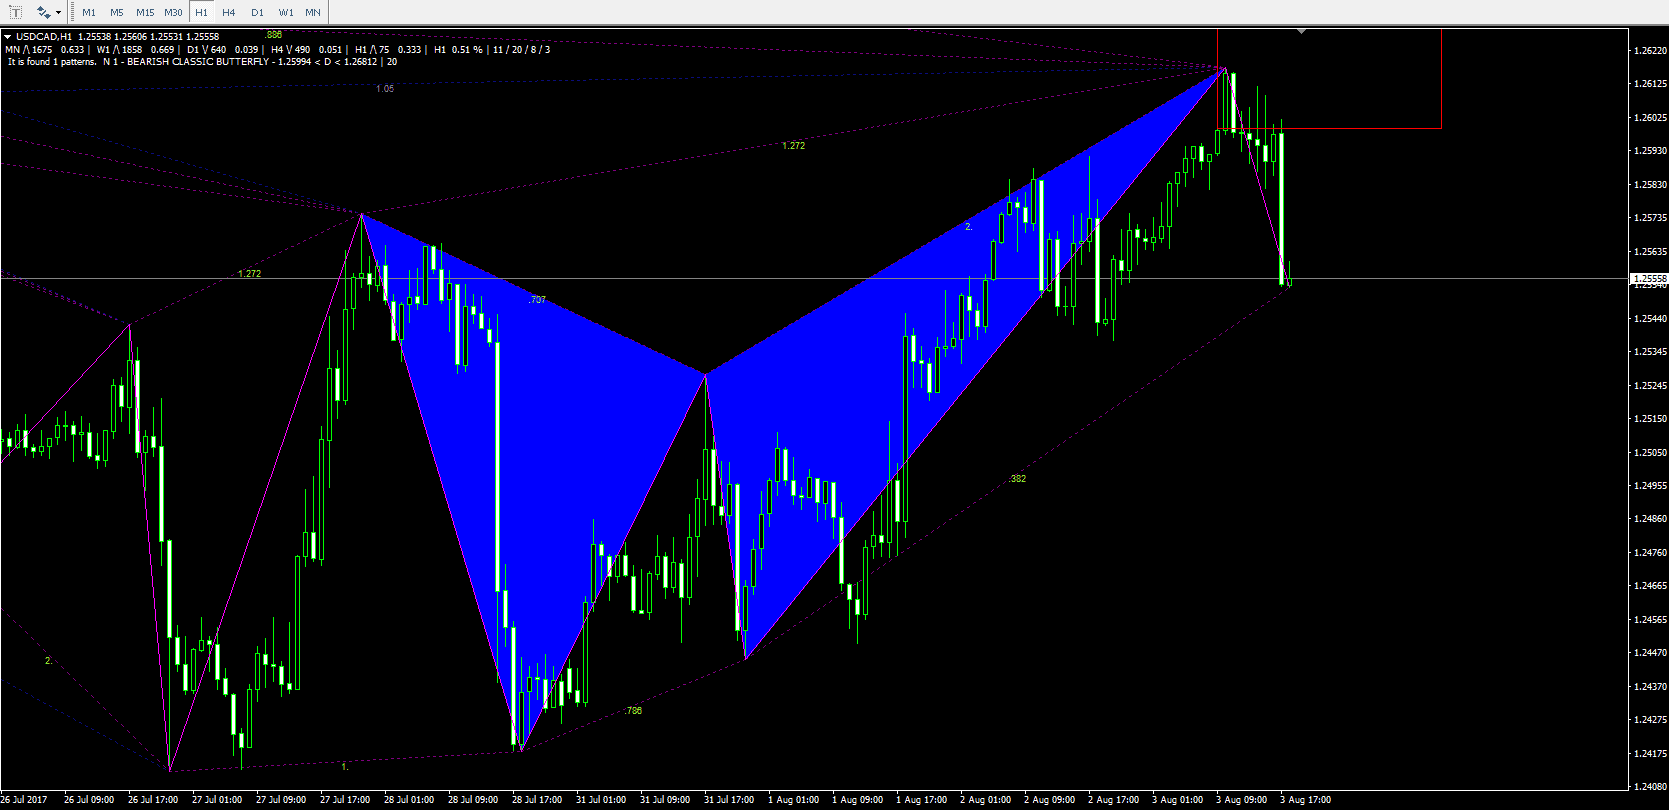
Figure 15. Profit from USD/CAD.
As you can see, our trade was closed on the USD/CAD pair with plus. Thus, the classic bearish Gartley butterfly pattern has worked its signal perfectly.
Let’s look at the other Gartley patterns:
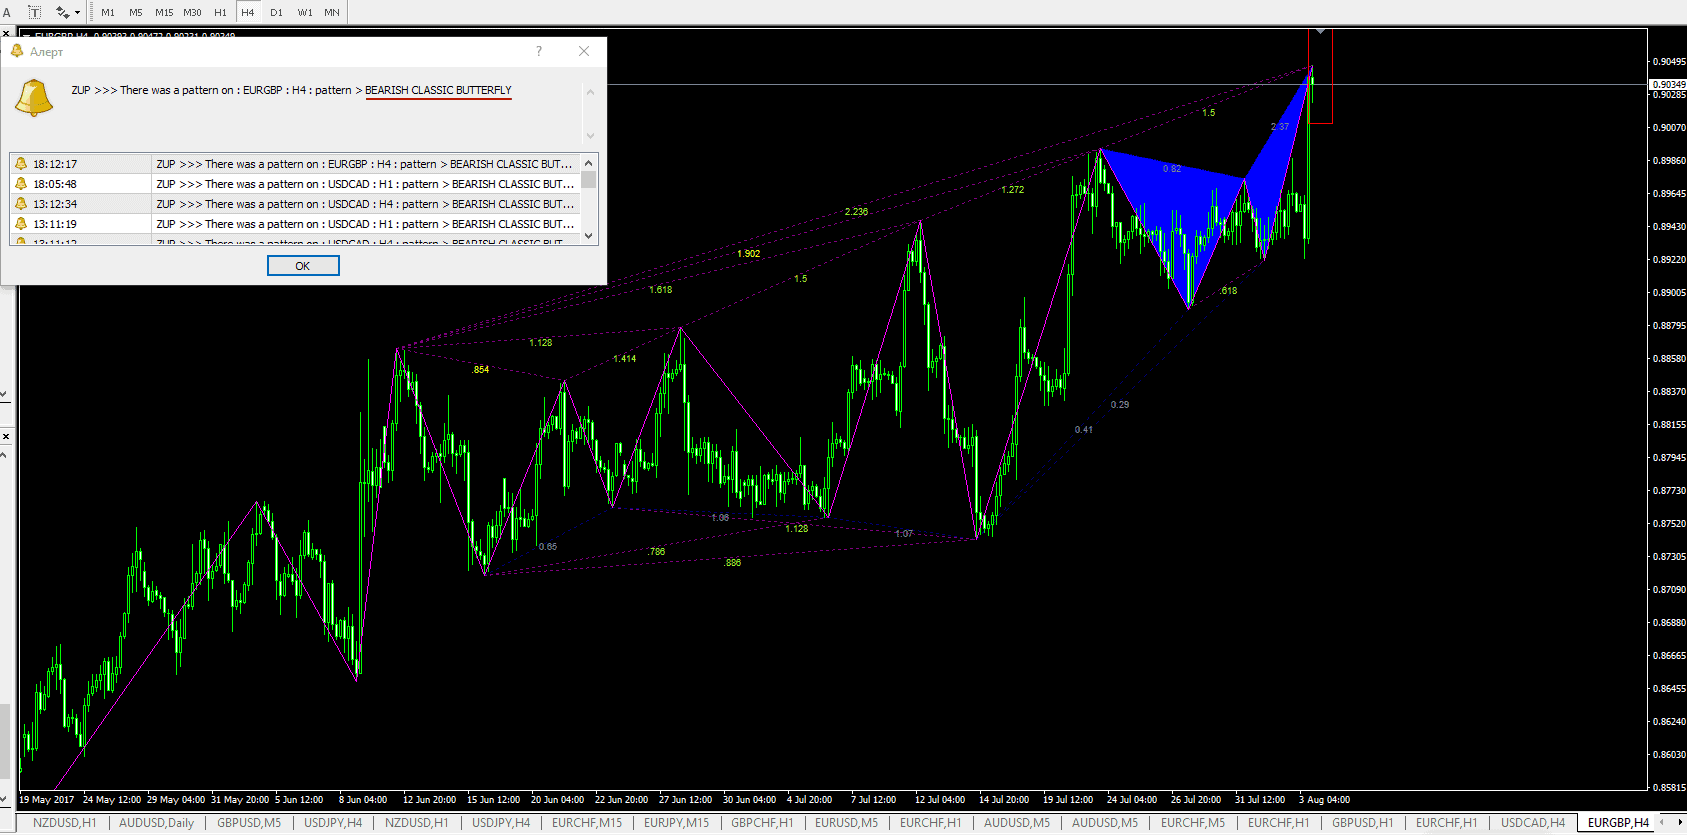
Figure 16. Classic bearish Gartley butterfly EGBP/USD (H4).
ZUP indicator which can be downloaded above gave a signal to sell EUR/GBP assets in the H4 timeframe. It showed a classic bearish Gartley butterfly. In the red triangle, you can apply Fibonacci retracement to find the exact entry to the market.
Conclusion
The most well-known Gartley patterns including a description of Gartley butterfly are described in the post. We’ve also shown how to bullish and bearish signals of butterfly pay their way on Forex. Also, we’ve provided a possibility to download the ZUP indicator that detects these candlestick patterns automatically on any timeframe, which facilitates the trader’s work much. You should follow your risk and money management, and soon you’ll see much more profitable trades.


hey Coach, i think most of pattern form in less than 1 hour time frame. But i think 4h is best time frame to trade with
I have a question about all these harmonics. How do you spot them, just eye-training or using fibs? I’m struggling with this haha, hope you can help me!
I have a question about all these harmonics. How do you spot them, just eye-training or using fibs? I’m struggling with this haha, hope you can help me!
Do a live session! Your work is so clear and easy to understand. You bring a new light to forex! Great job sir!
wesome tutorial… thanks
i have a question. is it better to only stick with gartley or we should look for cypher too? what is th main difference between them other than retracement.
wow!!very clear and straight,thank you very much sir. you made it clear for us newbies,
This gartley is just waiting to be back tested, I wish I could have a bit more time for that. Nevertheless, I’ll find some!
First is to express my gratitude, you are a hard worker and you exactly know what you are doing… thanks
Thnks