Go long when a price makes a low. Go short when a price makes a high. It seems like one of those “easier said than done“ situations. What’s the secret to identifying trustworthy entry points? One way to go is to use candlestick patterns known as pin bars.

Before reading the article and writing your questions in the comments section, I recommend to watch this video. It’s not long but covers the biggest part of questions on the topic.
Table of Contents
What is a pin bar?
In trading, a pin bar is a candle that catches a trader’s attention. Not only does it stand out among other Japanese candles but it also identifies trend reversals. In other words, if you see a pin bar on a chart, get ready for price action. Your goal is to learn how to convert price action into profit.
Pin bar is a Japanese candle formation that — alone or in combination with other bars (candles) — identifies price action that precedes a trend reversal. In this way, a pin-bar is the first indication of a trend reversal. While technical indicators in MetaTrader generate lagging signals, a pin-bar is a predictive indicator. It issues signals before a price starts to move in a new direction. Can you see the opportunity? If used wisely, this pattern can become a true goldmine!
What a pin-bar looks like
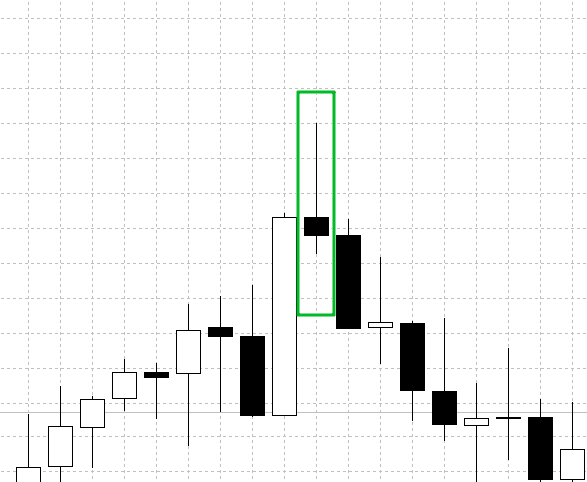
On a chart, a pin bar looks like a candle with a small or medium body and long upper and lower wick (or wicks). It’s not surprising that a formation like this stands out among other candles:

In terms of trend reversals, a pin bar must occur at the bottom or the top of a trend. A pin bar, that formed in the middle of a trend, poses no interest to traders.
Another important reversal pattern is a pin bar that occurs at a support or resistance level:

Pin bar at a strong resistance level
A pin bar in combination with another candle (or other candles) is extremely useful. On the chart below, a pin bar receives a confirmation in the form of a bearish candle that indicates a downtrend.

Pin bar and a bearish candle confirmation
How does a pin bar emerge? It all starts with a continuous trend, i.e. a bullish trend. As bulls are losing their grip on the market, the uptrend slows down. This is when a pin bar emerges. Its long wicks indicate that bulls and bears are currently balanced. Finally, bears start to take over the market and push a price in the opposite direction, forming a downtrend. This is exactly what happened in the chart above. The pin bar emerged right when an uptrend reversed into a downtrend.
Sometimes, a pin bar may look like an inside bar but it always forms at the top or bottom of a trend and precedes a trend reversal. Keep in mind that you need to trade a pin bar and inside bar differently.
Inside bar vs. Pin bar
If you know a thing or two about price action patterns, you must’ve noticed that a pin bar looks slightly like an inside bar. Both a pin bar and inside bar indicate that the current trend is about to change its direction. So what’s the difference between these two patterns? It’s easier than you think.

Just like a pin bar, an inside bar indicates a balance between bulls and bears. Both formations may have rather long wicks compared to their small bodies. The major difference between the two models is that an inside bar may form both in the middle and at the bottom of a trend and precede both a trend reversal and trend continuation. At the same time, a pin bar only forms at extreme points within a trend and indicates a trend reversal.
Pin bar indicator
A pin bar and other candlestick patterns are pretty hard to recognize on a chart. Luckily, there is a smart indicator that can help you detect a pin bar at its early stage.
The best part about this indicator is that it makes all detected pin bars noticeable by painting them in different colors. Plus, it issues a sound alert. All a trader needs to do is to assess whether the detected pins bar are trustworthy. If you have doubts, you should wait for another pin bar to form before you enter the market.
How to trade pin bars
Now that we’ve covered the pin bar basics, the next logical step is to learn how to turn this pattern into a money-making tool. The good news is that you can use a pin bar both as a part of an indicator strategy and price action strategy. You can even incorporate pin bars into your technical (graphic) analysis! The possibilities are endless.
Pin bar and indicators
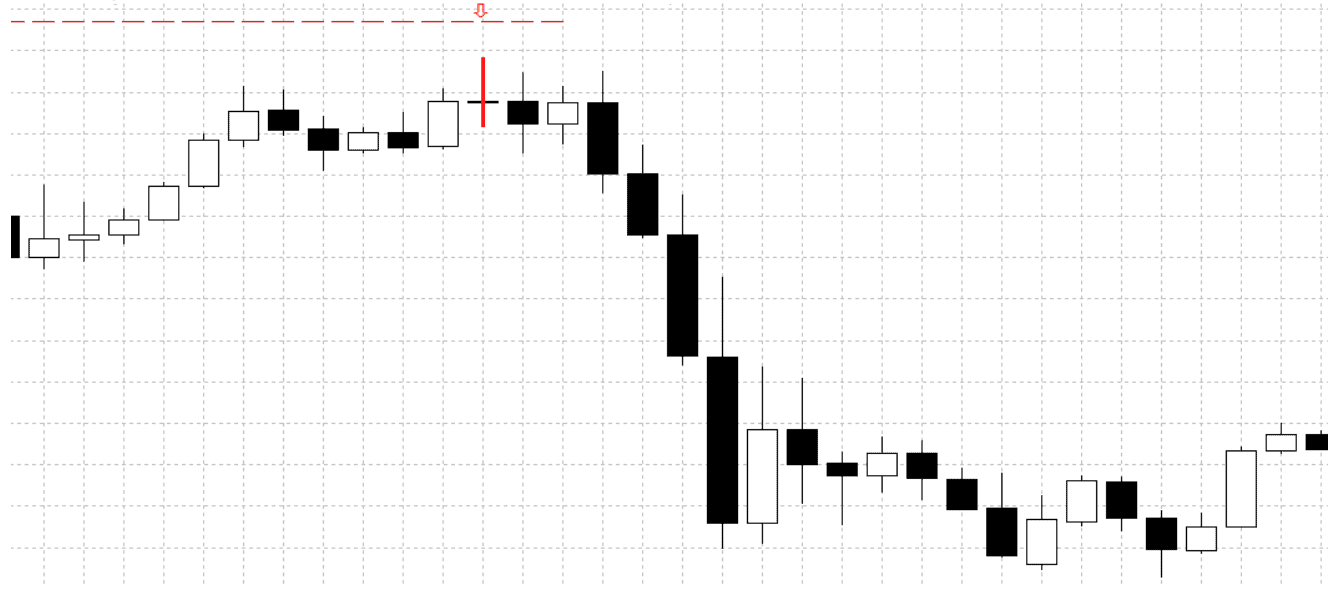
Take a look at the chart below. The indicator detected a pin bar and painted it red. This means that there is a possibility that the current uptrend may soon change its direction. Now you need to wait for confirmation from the Stock indicator. Once you see that its signal lines have crossed, you can go short:

Pin bar and price action
After a pin bar has formed, you need to wait for other candles (bars) as confirmation. On the chart below, we see a bearish engulfing pattern that gives us green light to open a trade:

Pin bar and technical analysis
If you’re a fan of technical analysis, you can use a pin bar as a confirmation after a price has bounced off of a trend line, price range boundary or support/resistance levels.

Pin bar trading strategy and take profit/stop-loss
When trading pin bars, you can use several methods to place a stop loss:
- 5-10 pips above/below the extreme point of a pin bar. The distance is used to filter off false signals:

- Above/below a support/resistance level.
When it comes to placing a take profit, there are also several ways to go:
- You can place a fixed take profit. The size of a take profit is determined by the timeframe and market you’re trading. Before you calculate your take profit, be sure to take your underlying asset and timeframe into account.
- Trailing take profit is 2-3 times larger than a stop loss. This way, you’ll walk away with a profit even if you’ve had less than 50% of profitable trades.
If you have a head on your shoulders, you have all chances to earn good money with Forex trading! With such a versatile tool as a pin bar, becoming a trading pro is easier than you think!


Hopefully i can start my vision following your tutor..Thank You for the explanation
That is a good price action analysis base… I trust pinbars
Pinbars means nothing these days, the HFT’s will push against these bars just because they know you will be there. this do not work any more, just saying
YOU ARE REALLY A NICE PERSON TO SHARE ALL YOUR IDEAS
Very informative tutorial! I have a question? when I look on the candlestick chart on the metatrader, shall I use the 30 min or 1 hr candle or maybe less? please let me know thanks
Thank you for being kind enough to share
Appreciated very much
Superb training
Can finally buy those Varsace sneakers