

In this article from our Price Action guide, we’ll talk about how to plot and use trend lines for profitable trading. While this lesson is meant for beginners, consummate Forex traders may find it useful as well.
Before reading the article and writing your questions in the comments section, I recommend to watch this video. It’s not long but covers the biggest part of questions on the topic.
Trend lines are widely used by traders to identify entry and exit points. Plus, trend lines may signal that a trend is about to change its direction. If plotted correctly, a trend line becomes a powerful tool for identifying the direction of a trend with a high degree of accuracy. Nonetheless, many traders (beginners, in particular) still make stupid mistakes drawing trend lines.
Table of Contents
How to draw trend lines
If there is an uptrend, a trend line must go through as many lows as possible (two, at least). For a downtrend, a trend line must connect at least two highs. Let’s take a look at the chart. For your convenience, the MetaTrader platform offers a special tool for plotting trend lines. Click on the “Trend line” on the tools panel.

Now your mouse cursor looks like a cross, with a part of the future trend line below it.

To draw an uptrend line, you need to connect consecutive higher lows.

On the chart, you can see a textbook example of an uptrend line. Place the cross on the first low and draw a line connecting as many higher lows as possible. These lows are the points where the candles attempted to go down but failed and the price continued to rally. Your trend line should look like this (see the chart above). Note that the line doesn’t have to go through every single low. Some of the candle tails may protrude beyond it. After all, our goal is not to plot an ideal line but to get an accurate tool to predict price action. Our trend line is a “floor” from which the price bounces off from time to time while continuing to climb up. As you can see, the trend is getting stronger. At some point, the price moved away from the trend line while still hovering around it. Finally, the trend has lost its steam. When this happens, a trader needs to plot a new trend line.

Now let’s plot a bearish trend line. This time we need to connect consecutive lower highs that are slowly going down creating a downtrend. Move the mouse cursor to the first high and draw a trend line through lower highs.

This is it! Now we have a bearish trend line. What happened to the trend? As you can see, the price abandoned the trend line and started to soar. Then, as in the first case, the trend lost its momentum. However, we can draw a new trend line through a new series of highs. Let’s find out how to do this.

This new line called a secondary trend line (see the chart above). As I’ve already said, the price started to go up forming another trend. The new trend line only lasted for a short period. However, if the price continued to climb up, our secondary trend line would play a more significant role in our trading. It’s no use following instructions to the letter. As a trader, you should rely on common sense.
When drawing trend lines, you should take the market reaction into account. Try to identify the points where the price bounces off the imaginary “floor.” Depending on the time interval you’re trading in, you can use both long-term and short-term (secondary) trends. However, the scheme for plotting trend lines is the same for all timeframes.

On the chart above, the price showed a short-term bearish movement. If we traded in that interval, we would plot a secondary downtrend. However, the market continued to move up creating a strong long-term uptrend.

As you can see, the uptrend lasted longer than the downtrend. We can say that the downtrend was simply a correction following which the price resumed its ascend. As I’ve already said, it all depends on your trading interval. If you traded within 10 bars or so, you would focus on the bearish trend. If you traded within a longer period, you would have to take long-term trends into account.
How to use trend lines in trading
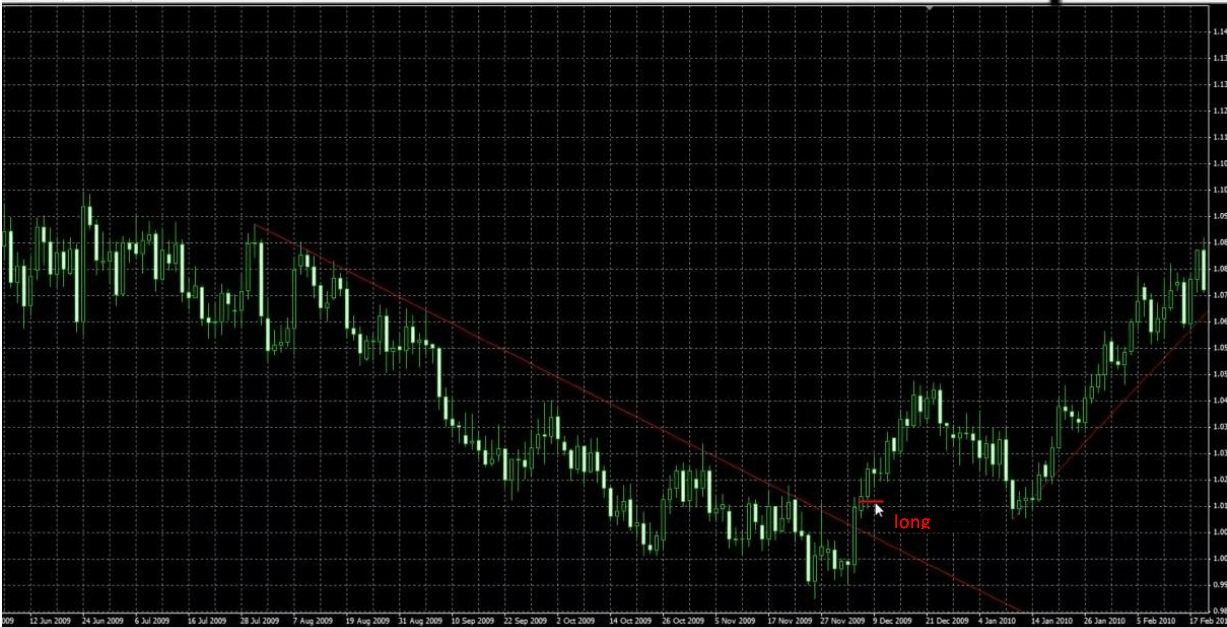
You plotted a trend line. What do you do with it? First, a trend line is a reliable support level, i.e. the price is highly likely to bounce off this level if a strong trend occurs. Breakouts of the support level provide good trading opportunities. Let’s imagine the situation when the price returns to the trend line and then bounces off it again. This may signal the continuation of a trend (an entry opportunity). Take a look at the chart below. The price fell and then want back to the trend line. Of course, at this point, we wouldn’t have the entire chart plotted in front of us. Plus, we would plot a trend line a little lower.

Look at the marked bar on the chart below. It’s a rebound from the trend line that signals a short entry.

On the next chart, we can see the price returning to the trend line. Here we’re dealing with a clear rebound because the candle is pointing in the direction of the bearish trend. If the candle moved close to the trend line, we could go short. But the candle goes against the trend. Let’s suppose a bullish candle came close to the downtrend line. The candle has just closed. Is it good timing to open a short position? The answer is “no.” You should wait for confirmation, i.e. a candle in the direction of the trend. Finally, a bearish candle occurs. Now we can open a short position, hoping that the trend will continue.
Breakout strategy
To use the breakout strategy, you need to wait for a reversal, i.e. till the price breaks out of a trend line in the direction against the trend. Let’s take a look at the chart below. Here you can see a trend breakout. You can see a trend line and breakout points, both actual and false.
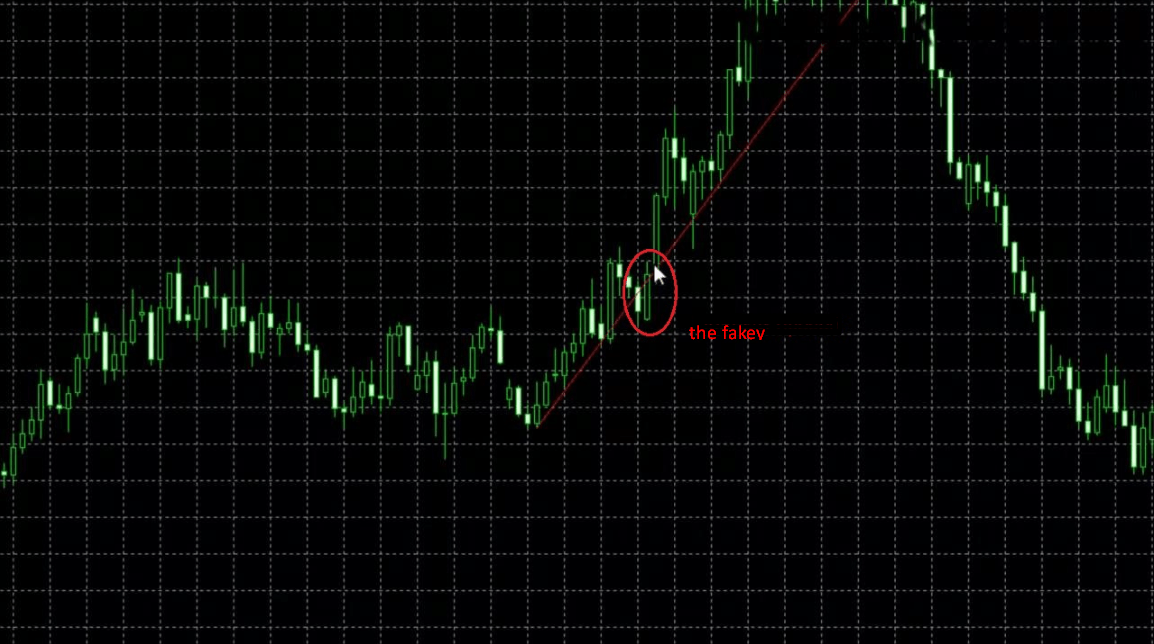
Although a candle has just broken out of the trend line, it’s still early to open a trade. Unless you want to fall victim to a false entry signal, you should wait for another candle. Then a bullish candle occurs. We wait and see what’s going to happen next. The price went back above the trend line, and an uptrend continued. It was a rebound. After the trend has been finally confirmed, we can open a long trade.
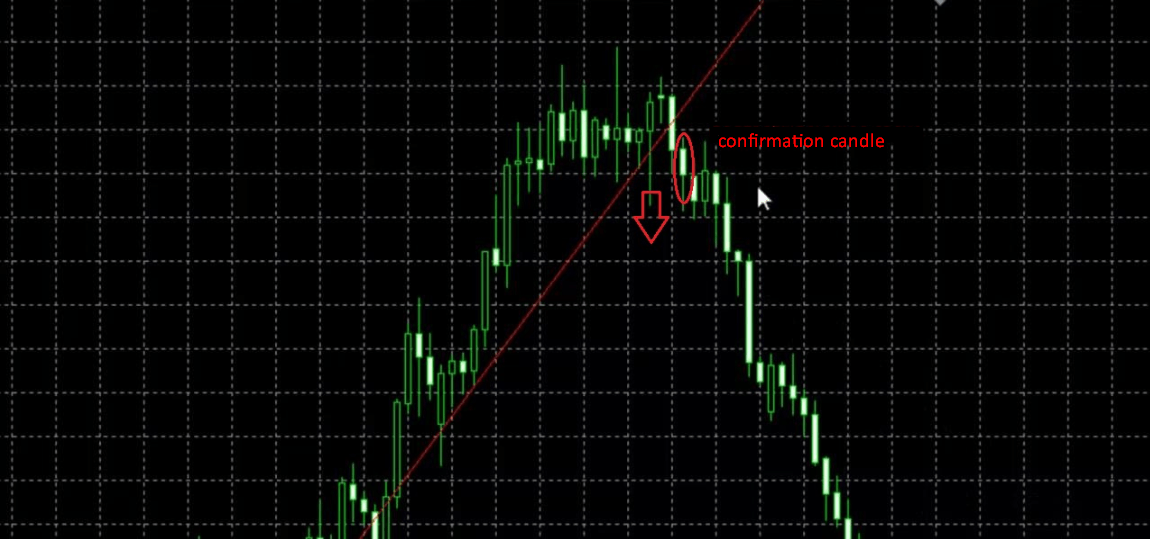
Now let’s switch to the next chart. The price broke out of the trend line. We should wait for a confirmation candle. A bearish candle occurred identifying a reversal. It’s a good chance to open a short trade because our take profits would be reached during the reversal. A breakout is usually followed by two possible scenarios.
- One is a reversal.
- Another is a consolidation before the trend continues (like it happened in our case).

On the next chart, you can see that a bearish candle broke down an uptrend. The bearish candle is followed by a bullish candle. Let’s wait and see how things pan out. A bearish candle with a tail pointing upwards occurs. This is a selling signal. Of course, your trading actions depend on what your goals are and how long you think the downtrend will hold. In a situation like this, it can’t hurt to look at other tools, such as technical indicators, graphic patterns, support/resistance levels, etc.

On this chart, we’re looking at a consolidation that resulted in an almost horizontal string of candles followed by an uptrend. This is not a reversal after a breakout but a consolidation before the trend continues.
Trend breakout: reversal or consolidation signal?
The truth is, you can’t tell right away. However, the angle of a trend line can give us some useful hints. The sharper the angle, the more likely that a breakout will be followed by a consolidation (and not a reversal). In other words, the steeper the trend, the more likely it will “break” at some point and then continue.

If the trend line is shallow and long, its breakout is likely to be followed by a reversal. Take a look at the chart above. There a downtrend lasted for quite some time and then ended up in a reversal. It’s not that simple, though. Along with a trend line, you should pay attention to other signals as well. If a trend line has been violated, don’t hurry to remove it from your chart. It can still be helpful! As you might’ve noticed, trend lines tend to continue. A smart trader can use them to place take profits and stop losses, as well as identify potential support/resistance levels. Let’s take another example of how you can benefit from an old trend line.

On the chart, you can see an uptrend breakout. Following the breakout, the price goes back to the trend line to test it. In this case, the bullish trend acts as a support level tested by the market multiple times. After the breakout, the trend line turns into a resistance level for a short time. In a situation like this, the price usually tries to return to the trend line and then continues in the opposite direction. In our case, after breaking out of the bullish trend, the price returned to the trend (almost touching it) testing it as a resistance level. After a short-term zigzag movement, the price went down.
Important: Don’t remove a trend line that has been broken. The price may go back to it signaling a reversal. Of course, here we’re not talking about a situation when the price breaks out of the trend line and then continues with the trend. The longer the trend line (the more highs or lows it connects), the more important it is for a trader. Plus, you need to identify how many times the price has bounced off the trend line and what angle the trend line has. The more shallow the trend line, the stronger it is. The sharper the angle, the less reliable the trend is, i.e. the more likely there will be a breakout. Furthermore, a trend line can be used as a shifting support level.

Suppose, you opened a long trade on the chart above. With each new candle, you move your stop loss below the trend line. This is what you call a trailing stop loss. A trailing stop loss is an order to automatically close a trade if the price moves against the trader by a specified number of points.
Conclusion
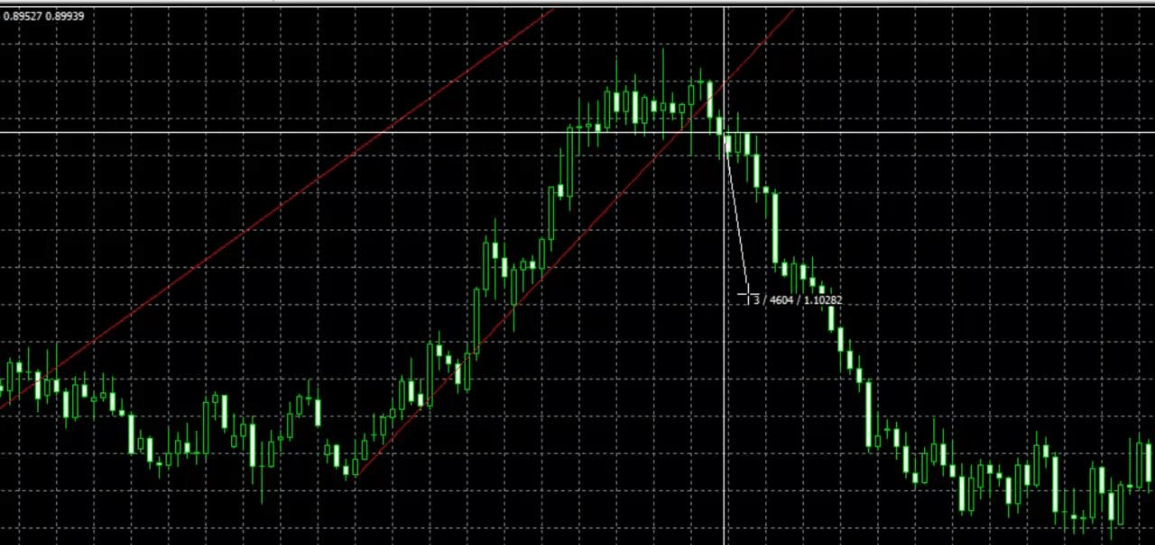
For dessert, let’s find out how to measure the minimum distance the price will move after a trend breakout. (If we’re dealing with a reversal, the price may go a long way.) We need this to determine a take profit that is highly likely to be reached. On the chart below, the price keeps bouncing off the trend line. Then a breakout occurs. Upon receiving a confirmation, we open a position.
You can see the entry point on the chart above. Now we need to set a take profit. To do that, let’s use the previous trend line. We need to identify the biggest vertical distance (in points) between the trend and the high/low. This distance will be our take profit.

In this case, the biggest distance was 410 points.

We opened a long trade. Our take profit (410 points) was reached after a short-term movement upwards and a correction.

Let’s take another example. Again, we measure the biggest vertical distance between the high and the trend line. The distance is 260 points. Right after the breakout, we set a take profit at 260 points.

As you can see, the price moved 300 points downwards. This means our take profit was reached.

In the chart above, the biggest vertical distance between the high and the trend line was 370 points. After a breakout, we opened a short trade with a take profit at 370 points.
Great! Our take profit was reached!
This is how you identify a take profit for trades opened after a trend breakout. It’s curious to know that the same method is used by trend lines as well.


Wow! This specific tutorial completely changed my view on how I look at charts. It also put into stark contrast how much more I have to learn. REALLY great job!
There were a lot of explanations but the goal of drawing trend line was very clear
do you have a myfxbook to view your live trading results?
By the way trendlines are great in hindsight… just like every other stock trading strategy that simply don’t work in Forex
This is probably the best thing I’ve seen about trend lines. Most materials show same crap that we already know, this one is distinct.
Excellent work
Keep up dude…. Good job
how do i join the course?
Man this is funny, never have I seen any trader use trend lines or support like that, 80% of the time never even used them.