

Keltner Channel is an envelope of moving averages formed around the EMA and tied to the volatility of the instrument. This indicator is very similar to Bollinger Bands, which uses the standard deviation to change the width of the channel. Instead of the standard deviation, in the Keltner Channel the indicator used is the Average True Range, or ATR.
Before reading the article and writing your questions in the comments section, I recommend to watch this video. It’s not long but covers the biggest part of questions on the topic.
The Keltner channel is a trend indicator used to search for turns in the breakdown of its boundaries. And today we will analyze the features of this indicator, and also see how it can be used in trading.
Table of Contents
History of the indicator
The description of the indicator The Keltner Channel first appeared in 1960 in the Chester Keltner’s book “How to make money in commodity markets.” Initially, this was the “10-day moving average trading rule.” The first version of the Keltner Channel was built around a ten-day simple moving average calculated at a typical price ((High + Low + Close) / 3) as the centerline. To build the channel, a ten-day distance between the maximum and minimum points was used, that is, the difference between the maximum and minimum price for 10 days.
Then, in 1980, the well-known algot trader, the founder, and president of LBRGroup Linda Raschke introduced the modernized version of the Keltner Channel to the public, where the ATR indicator was already used to calculate the channel width.
Another talented trader – Robert Colby – advised to take the closing of the bar as a cost and apply Linda Raschke’s modification together with the exponential moving average (EMA). This is how we know this wonderful indicator of our time.
Description of the indicator
All indicators based on channels, envelopes, bands, are created for the analysis of trend movements. However, if the price is outside the boundaries of such an indicator, this is a fairly strong signal, since it happens not that often. The fact is that trends usually begin with a sharp strong movement in one direction or another, and a strong channel breakdown can serve as a signal for the emergence of a new trend.

The Keltner channel is a trend indicator, and, like the moving averages laid in its foundation, has the property to lag decently.
Despite its almost 100-year history, this indicator is unfairly forgotten by developers of the most popular terminal on the Forex market, MetaTrader 4.

The settings are sometimes different depending on the implementation of the indicator, but as a rule it is the period of the exponential moving average that sets the centerline of the indicator, as well as the period and multiplier of the ATR indicator for constructing the boundaries of the indicator.
Calculation of the indicator and parameters
The Keltner Channel indicator can be calculated in three steps. First, we calculate the exponential moving average, then ATR, and then add or subtract the ATR moving value multiplied by some coefficient from the reading.
Middle Line: 20-day exponential moving averageUpper Channel Line: 20-day EMA + (2 x ATR(10))
Lower Channel Line: 20-day EMA — (2 x ATR(10))
The longer you take for calculation, the stronger the indicator will fall behind. The larger you take the coefficient for ATR, the more difficult it will be to break the price of the channel boundary. Changing the ratio from 2 to 1 will halve the channel width. Here is a chart with coefficients 1, 2 and 3:

By default a deviation of 2 is usually used, in the figure above it is highlighted in green. A wider channel with a deviation of 3 is indicated by the blue color and a narrower one with a deviation of 1 by the red color. All three channels are built on EMA20 using ATR10. The more volatile the currency pair has, the wider channels are formed.
Now that you have got acquainted with the formula, you are well aware that the boundaries themselves can be made more volatile, reducing the ATR period and more, for example, wide, increasing the ATR multiplier.
Comparison with Bollinger Bands
As you can see, the indicator is very similar to Bollinger bands, but there are some differences.

The blue color indicates the Keltner channel (KC20 (dev2, ATR20)), the crimson color indicates the Bollinger bands (BB20 (dev2)). As you can see, the main difference is that, firstly, the Keltner channel turns out to be smoothed, because the bandwidths are based on the Standard Deviation indicator, and its readings are more volatile than the ATR indicator readings. Many traders consider this a plus since the boundaries are “more permanent”. This makes the Keltner indicator more suitable for strategies for following a trend and for identifying a trend. Secondly, the Keltner channel is built around an exponential moving average, which has a higher sensitivity than the simple moving average used to construct the Bollinger Bands.
Using Keltner Channels to work on a trend
The author of the indicator advises us to take into account seasonality and cyclicity when applying this indicator. From his words, many tools have certain seasons, when good trend movements are most likely. Therefore, Chester advises to take this factor into account in his trade and use seasonality as a filter for opening as far as possible. Naturally, Keltner means seasonality on the daily charts.
When working on a trend, you should see that the upper and lower boundaries have a trend toward the planned trade. The same is with the moving average. By the way, this rule is used in many trading systems. For example, in already fairly forgotten Forex Gambit strategy, the twenty-day slope of the middle line is taken into account. According to the classic rules, we must trade between the upper boundary and the center with an uptrend, and the lower boundary and the center at the descending trend. In this case, of course, the opening of a trade should occur when you roll back to the middle line.
In this case, experienced traders also pay attention to the candlesticks: the price should either touch the midline on rollback or be very close to it. The breakdown of the opposite channel is allowed, but not more than 1/2 of its width, but such an opening is considered rather risky. Also, candlesticks on younger periods should show a turn towards the deal.
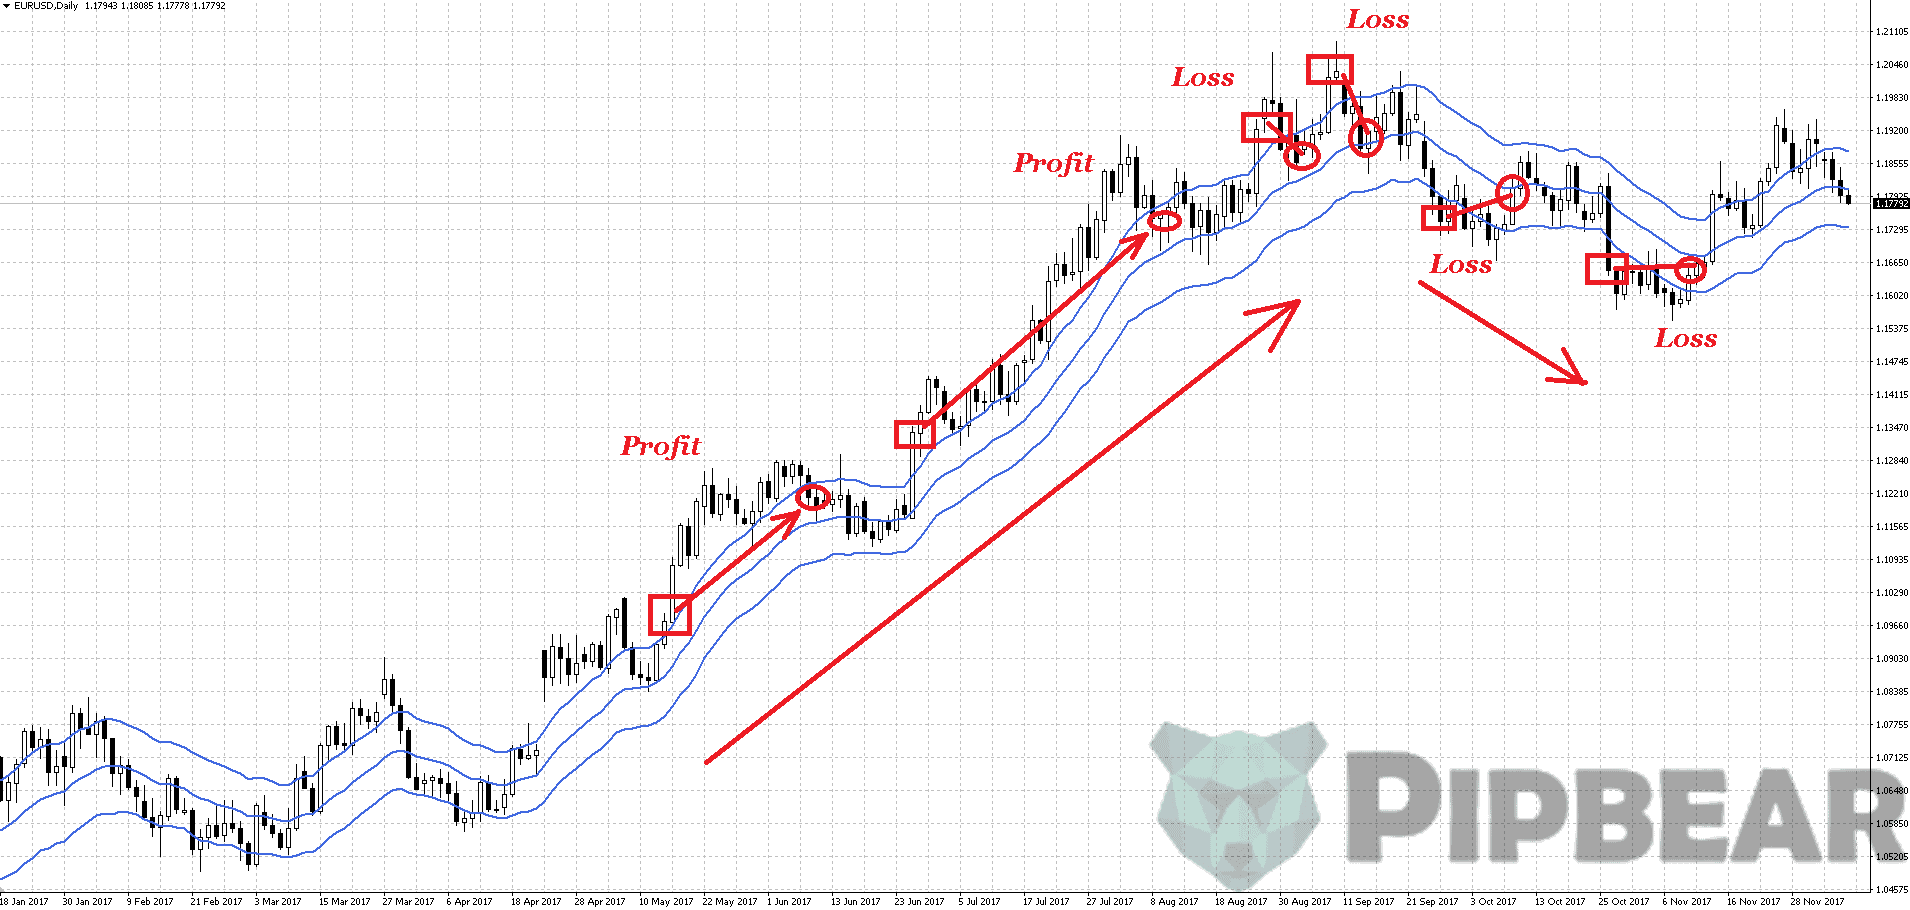
Closings, as a rule, are carried out at the canal boundaries. Let’s illustrate this approach:

Rectangles indicate the possible places for entry into positions, the arrows indicate the slope of the channel and, accordingly, the direction of the trend. The asterisks denote the alleged exit points in profits, and the crosses – in losses. As you can see, profitable trades prevail in trend areas.
Using the Keltner Channels indicator to work in the channel
Another option for using the indicator is to work inward to return to the central moving average, that is, from the canal boundaries. This type of trade appeared later than the appearance of trading on the trend and initially the Keltner channel was created as a trend indicator. Nevertheless, this fact does not prevent its use in the “return to the average” strategies. As a rule, to further confirm the signals, oscillator readings, mainly CCI, RSI and WPR, are used in this case. Slightly less often Stochastic Oscillator is used.

By and large, algorithms for calculating oscillators are similar, and the main differences arise in the degree of smoothness, sensitivity to price changes and the rate of change in indications. Therefore, it remains a matter of personal preferences, which one of the oscillators to use. At some points more signals appear, at some – less, some are more accurate, others are less. The optimal oscillator on one pair of a certain timeframe can be, for example, WPR, on the other – RSI.
Therefore, of course, it is worthwhile to select a pair for the Keltner channel based on tests on historical data. It is worth noting that trading to return to the average turns out to be more effective in quiet periods of lateral movements, while trading from the centerline of the channel, taking into account its inclination, works better during periods of a stable trend.
Also, I often met the recommendations to switch to work on a trend, if the ADX is above a certain value, usually 20-30, and to work in the channel at values below this value.
Application of Keltner Channels for work on breakdown
The third way of trading on the indicator of Keltner Channels is as follows:
A narrower coefficient is used for the ATR (in this case 1), then the work is performed on the breakdown of the Keltner channel boundary, provided it tilts toward the breakdown. The closing is usually carried out either at the centerline of the channel or approximately in the middle of the band, without waiting for the price approach to the central line. A more risky approach involves entering immediately at the closing of a candlestick outside the broken channel, but cautious traders prefer to place pending orders just above/below the high/low signal candle.
You can also use other closing tactics: a trailing stops, signals from other indicators and so on. For filtering, the ADX indicator is sometimes used, making sure that its readings are at the moment of breakdown not lower than a certain value, usually 40-50. This type of trade is characterized by a series of small losses, when the market is in a calm state and large, but not frequent, profits.
As a rule, profits exceed loss-making transactions by 5-10 times, but the percentage of profitable trades is rather small – below 50%, often about 40%, sometimes even 30%. Psychologically, it’s very difficult to trade like this, because you do not know in advance where the next profitable trade is waiting for you, which will pay off all previous minor losses and bring long-expected profits.
Conclusion
Like any other channel indicators, Keltner Channel has the same positive and negative sides, just some of them are less pronounced. Nevertheless, the Keltner channel is an excellent trend indicator, originally developed specifically for the strategy of entering the trend transactions after the kickbacks.
The indicator is very old, and during its existence, acceptable strategies have been developed for both markets in the trend and for markets moving in the sideways. And this makes the Keltner channel a fairly versatile tool, especially when correctly aligned with other indicators and candlestick patterns.


Awesome video sir..and you explain these trading topics so effortlessly and simply..really great stuff here.
Nice Job! very clear and simple analysis with specific examples that shows the pros and cons of Keltner Channel
awesome…crystal clear..thanks so much
You explained the Keltner channels really well coach… I like this strategy and I’ll remember this for next time! thank you
Love the content keep it up!!!!
Great content. What platform do you recommend to actually buy these stocks?(slightly off topic, i know)
Keltner Channels seems like a good strategy.
Very useful content
Thanks man
This guy’s a master of technical analysis
There are many reasons why Keltner Channels are superior to Bollinger Bands for short term trading.
What is the most suitable trailing stop setup which accounts for volatility and maximumum profit. Ofcourse a trailing stop method whether keltner or standard deviation x multiplier would have to be a balance between
volatility and tightness allowing for max profit.
I’m looking for more information on channel trading in conjunction with candle patterns? Any resources you recommend, books etc?
perfect stuff! I used keltner channels for my long term trades
20 periods is fine of Keltner channels because they’re mostly used for short term trading.
Thanks for your insights
Well, it is a great content