

Watching price behavior in different markets, you may come to a pretty unexpected conclusion. If you look at a price chart, the first thing that comes to your head is that all price movements are random and lack logic behind them. This assumption is not far from the truth.
Before reading the article and writing your questions in the comments section, I recommend to watch this video. It’s not long but covers the biggest part of questions on the topic.
But if you take a closer look at price dynamics and search for patterns in price movement, you may change your opinion. There is multiple evidence that history repeats itself and certain price patterns tend to reappear. Keen advocates of this approach include such big names as Ralph Elliott, who invented Elliot Wave Theory, and Bill Williams, the author of Chaos Theory.
If you take the price of any currency pair and monitor its dynamics over a long period, you’ll discover that it forms recurring patterns.
By identifying and analyzing such graphic formations, you can predict how the market situation is going to evolve. In this article, we’ll examine a curious candlestick pattern known as “Ladder Bottom” or “Marubozu setup”.
Compared to other graphic models found on price charts, Ladder Bottom can be called a unique formation with a rather peculiar structure. As one might guess from its name, the pattern features some “bottom” level below which a price won’t go. In other words, Ladder Bottom predicts a bullish reversal. Note that Ladder Bottom doesn’t have the opposite “twin” pattern that would predict a bearish reversal.
The Ladder Bottom pattern consists of five candlesticks that emerge in a certain order. The first three candles are black and confirm the existing downtrend. The size and wicks of these candles are of no particular importance. For the most part, though, these candles have long bodies and short wicks (if any at all). If you look closely, you may notice that at its early stages Ladder Bottom looks like the Three Black Crows pattern.
The fourth candle is also black but slightly different from the previous three. First, it doesn’t have a lower wick (remember the famous Marubozu candle?). Second, it had a pretty long upper wick.
And last but not least. The fifth candle in this pattern is white. It’s a bullish candle with a long body. Whether or not the final candle has wicks is irrelevant. The most important thing to understand about the fifth candle is that its body gaps up above the fourth candle. Plus, it should close above the two previous candles to indicate that the price is going up.
Fig. 1. Ladder Bottom (marubozu)
Bu looking at Figure 1, you can see that each of the four black candles is lower than the previous one. The downward tendency is so strong that you can’t help but think about a ladder. Now you know where the pattern got its name.
Like any graphic pattern, Bottom Ladder has its trading rules. If you want to trade this pattern, you may find these insights helpful:
Luckily for traders, the Ladder Bottom pattern is a pretty straightforward formation that is easy to identify on a price chart. Plus, this candlestick pattern only exists in a bullish variation. However, this doesn’t mean that seeing a Ladder Bottom on a chart is enough to make an entry. Be sure to pair this pattern with other indicators and enter a trade only after receiving a confirmation signal.
If you’re trading intraday charts, there are two important rules you should keep in mind. Rule No.1 applies to the first four candles and says that the opening price of each new candle must be the same as the closing price of the previous candle. Rule No.2 says that the fourth and fifth candles must open at around the same price level (Fig.2).

Fig. 2 How to trade Ladder Bottom on intraday charts.
As we’ve already mentioned, the fifth candle is the only bullish candle in the Ladder Bottom pattern. During the formation of the fifth candle, you should monitor how the volume changes. When the bullish candle is emerging, the volume is supposed to grow (Fig.3). If this is not the case, the pattern is not to be trusted.

- Fig. 3 Formation of a Ladder Bottom pattern3. If you switch to a higher timeframe, a Ladder Bottom will transform into a Hammer, another bullish reversal pattern (Fig. 4).
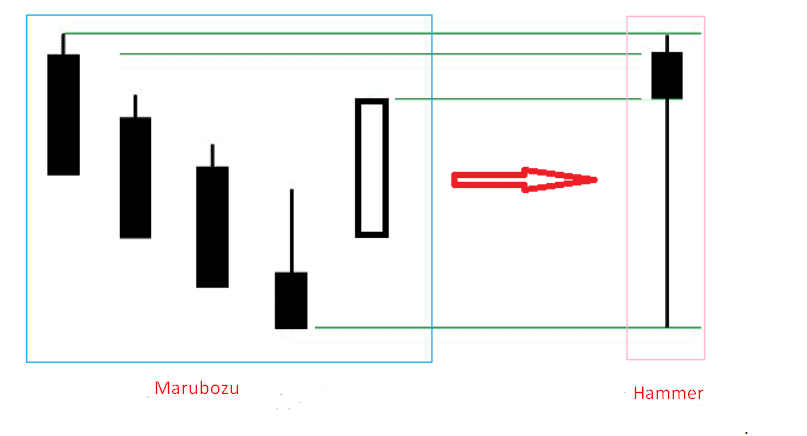 Fig. 4. Ladder Bottom transforms into Hammer.What does the Ladder Bottom pattern say to a trader? It indicates that the downtrend is coming to an end and the price is about to head up. This is the time when you might consider going long. While dreaming about juicy profits, don’t forget to use other trading tools to confirm the signals generated by Ladder Bottom!


Thanks sir you improved my trading skills ….if u wana charge a fee i will b happy to pay you some fee but i encourge ur efforts becuase u are providing a free education to whole world
Nice sir, em really impressed. Your way of teaching is wonderful
Doing great work Sir. And thanks four your guidance.
Very great session sir. Thanks for sharing the knowledge sir. I have following questions regarding the Marubozu candle stick. In what time frame the marubozu will be efficient to spot the trend ?
Thank you sir for your tutorials…. I have no doubt this will improve my trades
Very good and educative videos on candlesticks. It is helping me understand the candlesticks that are vital to trade with understanding. Maybe after watching all your videos I may be able to trade a little better.
Sir I am a beginner… Thankyou sir
great sir ….. keep guiding us
Sir…. Be blessed